Currently i have nearly 35 request sampler to accomplish a complete task in app using Jmeter and its working perfectly. But however i need to see the Graphs of the same for 500 requests either in Histogram / Pie chart or in line chart to analyse the same.
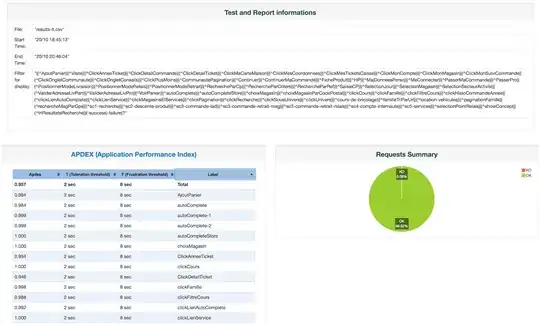
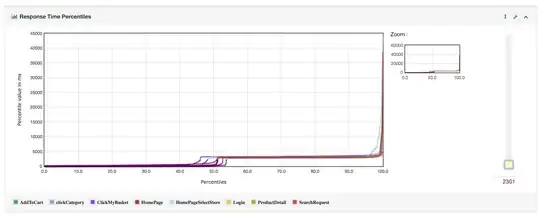
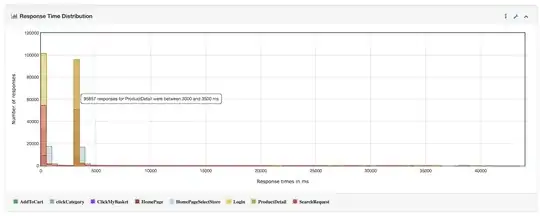
Is there any way to accomplish the same in Jmeter ?