Thanks to this excellent analysis of the Plot algorithm by Yaroslav Bulatov, I now understand the reason why Plot3D and ContourPlot fail to draw smoothly functions with breaks and discontinuities.
For example, in the following case ContourPlot fails to draw contour x^2 + y^2 = 1 at all:
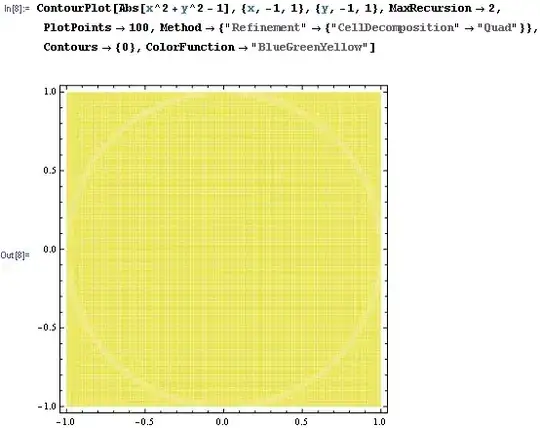
ContourPlot[Abs[x^2 + y^2 - 1], {x, -1, 1}, {y, -1, 1}, Contours -> {0}]
It is because the algorithm does not go deeply into the region near x^2 + y^2 = 1. It "drops" this region on an initial stage and does not try to investigate it further. Increasing MaxRecursion does nothing in this sense. And even undocumented option Method -> {Refinement -> {ControlValue -> .01 \[Degree]}} does not help (but makes Plot3D a little bit smoother).
The above function is just a simple example. In real life I'm working with very complicated implicit functions that cannot be solved analytically.
Is there a way to get ContourPlot to go deeply into such regions near breaks and discontinuities?