I'm very new to Python, and I have a CSV file with three columns. They represent a transmission time in milliseconds, signal amplitude, and FM radio frequency in kHz. There's a lot of lines, but they look something like this:
My task is to find out which radio frequency is generating random noise and which is a structured signal. For how to do this, I'm trying to first find the unique values in the frequency column of my data file (column 3) and then plot them individually to find the structured data. My guess is that the 71.231012 frequency is the white noise (it seemed less frequent in the file), and so I'm basically trying to plot both frequencies to see if my guess is somewhat correct.
So far, this is my code:
from __future__ import division
import matplotlib.pyplot as mplot
import numpy as np

file=open("data.csv", "r")
data=file.read()
data=data.replace(" ", ",")
data=data.split("\n")

xscatter=[]
yscatter=[]

for row in data:
    row=row.split(",")
    row[2]=float(row[2])
    if row[2] == 71.231012:
        xscatter.append(row[2])
        yscatter.append(row[1])

mplot.scatter(xscatter, yscatter, color="blue", marker="o")
mplot.show()
But I keep getting this error:
row[2]=float(row[2])

IndexError: list index out of range
I'm not sure why this is the case; I thought that, with the split, I would have three indexes per row (0,1,2). And because I'm so new to Python, I'm also not sure how accurate or efficient my code is at doing what I want, but it's a start. I'd greatly appreciate some help.
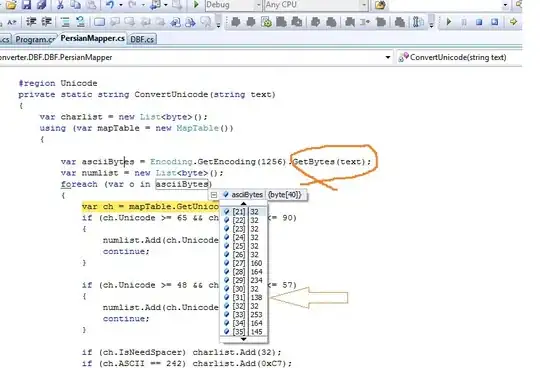
EDIT: Here is a sample of my output after splitting the file, before the for loop:

