You asked to clarify two terms: Spectrogram and chroma.
Spectrogram is a visualization of the frequency spectrum, a breakdown of the sound into pure sinusoids of different frequencies. A spectrogram provides a view of how the amplitude of the different frequencies vary according to time. This can be shown on a 2D plot (alternatively a 3D plot) where x is used for time, y for frequency and a color denotes amplitude at any frequency component found in the sound:

Voice spectrogram, source
In these plots, axes can be linear or logarithmic, and frequency axis can even be note names (sometimes referred to as pitch classes) instead of actual frequencies, as each note corresponds to a frequency. In this latter case the plot is rather called a chromagram. See section further below for details about plots used in audio analysis.
An octave is any range of frequency f to 2*f. Each octave can be divided into seven intervals, using 8 notes. For an octave starting at C: C, D, E, F, G, A, B, C. These degrees are called the (C major) diatonic scale, this is the scale we all learned at school:
An interval is measured as the ratio of the frequencies of the notes. Five intervals have the same value, a tone, and the two other, E-F and B-C, are only half of this value, a semitone. This division is found in all octaves, as doubling of halving the frequencies doesn't change the ratios. On a piano keyboard, these notes are the white keys.
There is another scale, which divides the octave into 12 equal intervals, using 13 notes. This scale is the chromatic scale, chroma just refers to these notes:
The notes composing the chromatic scale are the notes of the previous scale plus notes splitting all full tone intervals in two equal intervals of a semitone. On a keyboard, these notes are the black keys.
Music, except in rare cases, is not composed using the chromatic scale (all semitones). Instead a diatonic scale with more full tones than semitones is built from the pool of the chromatic notes, by selecting a starting note and a scheme for the intervals to be used. Today there are two interval schemes used: Major and minor. With 12 possible starting notes, there are 24 possible diatonic scales.
Chroma: Big word for a trivial concept
As seen above, chroma, chroma analysis and chroma feature sounds big business, there is nothing to worry about, chroma is the hype wording for saying note or pitch of the chromatic scale, the ordinary set of notes used in Western music.
Spectrogram
The spectrogram is a 3D representation, axis x is time, axis y is frequency and axis z is generally amplitude or power (power is generally the square of amplitude). Z value is indicated by the color of the pixel at grid point (x,y).
Any axis, x, y or z can be made logarithmic using decibels. For a power scale it corresponds to the transformation: dB = 10 log (P/P0), where P0 is a reference value, 1 unless otherwise specified. Doubling is +3dB. As power ratios are the square of amplitude ratios, the decibel value for amplitude is dB (amplitude) = 20 log (A/A0).
The graph below shows the power (z as gray scale) expressed in dB for the frequency y (Hz) at time x (x scale is not shown).
The same with gray shades replaced by colors:
The next graph is identical, except the y scale is logarithmic instead of linear, which makes more sense if energy is concentrated at the beginning of the scale (low frequencies), like here under 1 kHz:
This next graph is the same. From the title it seems power is shown instead of amplitude, but visually there is no color difference:
The next graph is similar, except the "constant Q" title likely means power values are computed using a constant-Q transform (CQT):
The CQT (instead of the usual discrete Fourier transforms) might be an attempt to extract more accurately the notes from the signal.
The same data are shown in the graph below, but y is labeled with note names instead of frequencies:

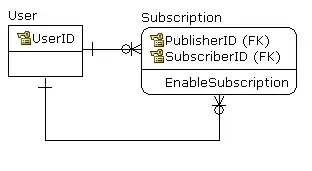
Chromagram
The chromagram is a specific spectrogram where the y axis and the z values are particular.
Scale y includes only the 12 notes of the chromatic scale.
Z value is the summation of all sounds which correspond to each notes, regardless of the octave, so C is the sum of C0 (C in octave 0), plus C1 (twice the frequency of C0), plus C2 (twice the frequency of C1), etc. These notes are all harmonics of C0.
You may wonder why the octaves are summed, loosing the actual frequency information. It's specific to musical sounds, that is sounds produced by resonant devices. When such device produces a sound of frequency f, it also produces sounds at multiples of f (harmonics at 2f, 3f, 4f) which individual strength is imposed by its musical timbre.
In addition as explained in the introductory section about music scales, when a piece of music is created, a scale is selected. This choice freezes the 7 notes which are used for the piece, whatever the octave used. The isolated use of foreign notes (accidentals) make them less frequent in the piece, and therefore less frequent in the chromagram.
A chromagram:
What the z axis does represent is not mentioned, possibly it's the amplitude (or power) relative to the maximum found in the signal (around note E).
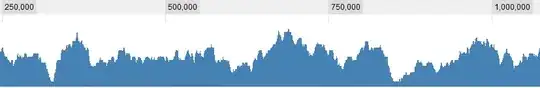
The last graph is different in that the y axis doesn't show signal pitches but the tempo (beats per minute) of the sample.
Tempogram
The scale is logarithmic. The color indicates how much frequently this number of BPM is detected. More than one value of BPM is detected because there are several notes shorter than a time. The notes repeat at frequencies higher than the actual BPM. Usually the algorithm used to perform the analysis also provides the most probable BPM, taking onset distribution (e.g. librosa).


