I would like to create a plot with a legend aligning the text of the different curves. Here is a minimal working example:
import matplotlib.pyplot as plt
import numpy as np
x=np.linspace(0,10,100)
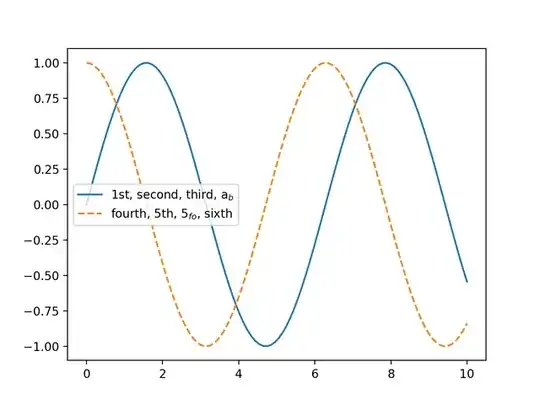
plt.plot(x,np.sin(x),'-',label=r'1st, second, third, a$_b$')
plt.plot(x,np.cos(x),'--',label=r'fourth, 5th, 5$_{fo}$, sixth')
plt.legend()
plt.show()
I want the labels to align in the legend, so get something like:
1st     second     third       a$_b$
fourth  5th        5$_{fo}$    sixth
Is there a way of doing this?