I have data from stimulation of subjects with different intensities (say we have 54 different intensities), and what follows is the percentage of them recognizing the respective stimulation:
x = [0 0 0 0.50 0 0 0 0 0 0 0.5 0 0 0 0 0 0 0 0.125000000000000 0 0.333333333333333 0 0 0.111111111111111 0 0.428571428571429 0 0.285714285714286 0.166666666666667 0 0.1 0 0.400000000000000 0.5 0.4 0.25 0.6 0.727272727272727 0.714285714285714 0.25 0.666666666666667 0.777777777777778 1 0.75 0 1 0.9375 1 1 1 1 1 0.92 0.92]
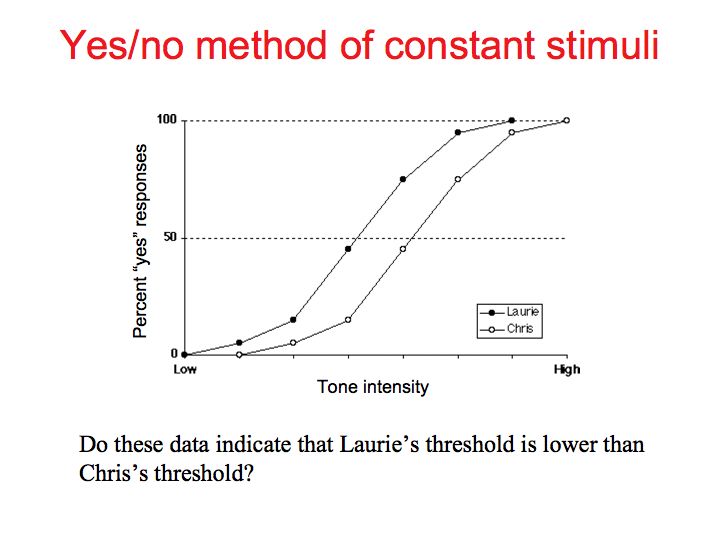
Say the first index is the weakest stimulation, and the last index the strongest, as visible the stronger the stimulation the more likely the subject recognizes it. I want to fit now a distribution to these values, to get something called a psychophysical curve (looks like this).
What I have tried is:
pd = fitdist(x,distribution);
but this throws an error, I assume because of the 0's in the x array. What could I do alternatively?