Top post: I have accepted an answer,but it doesn't work for me. I will post a new question, stressing Delphi 7. Thanks to all who gave some good input
I have measurements taken at one second intervals over an hour.
I had a previous question where it was taking 45 seconds to updates a TStringGrid and managed to get that down to "faster than the eye can see". Partly by moving some computation and database related functionality of of the loop, but - surprisingly to me - the change that really made the difference was setting the strindgrid's rowCount to 3600 before the loop rather than incrementing it inside the loop.
Now I have a similar problem with a TChart. Maybe if I try preallocating the chart? So, I could Chart1.Series[0].Count := 3600, but than I can't use AddXy() or Add(), so how would I explicitly set the values in series?
I have a very simple chart, with Floats on the y-axis and hour:seconds on the x-axis
Can anyone help, or suggest another way to speed up chart drawing?
Update: several have suggested using TFastLineSeries, but I don't see how.
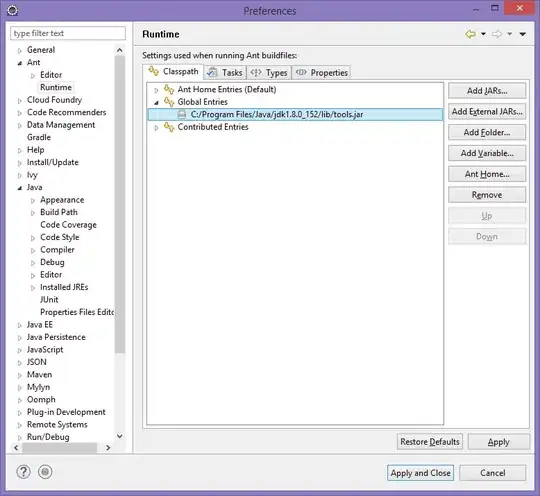
Aha - double click on the Chart, to show all series, select one & click change