I did something like this a while back for fun, inspired by a Kaggle competition on leaf classification. I used opencv for finding the contours of the images. Below is the code for python 2.7. See here for the orientation of the returned contour. You may have to adapt it for your needs, specifically the thresholding part. Hope this helps.
import cv2
import numpy as np
import matplotlib.pyplot as plt


def shape_desc(im):
    # threshold image
    _, bw = cv2.threshold(im, 128, 255, cv2.THRESH_BINARY)
    # find contours
    contours, hierarchy = cv2.findContours(im.copy(), cv2.RETR_EXTERNAL, cv2.CHAIN_APPROX_NONE)
    # extract largest contour
    largest_idx = np.argmax([len(contours[i]) for i in range(0, len(contours))])
    # get (x,y) coordinates
    x = np.array([contours[largest_idx][i][0][0] for i in range(0, len(contours[largest_idx]))], dtype = np.float).reshape((len(contours[largest_idx]), 1))
    y = np.array([contours[largest_idx][i][0][1] for i in range(0, len(contours[largest_idx]))], dtype = np.float).reshape((len(contours[largest_idx]), 1))
    # find the centroid
    m = cv2.moments(np.array([[x[i][0], y[i][0]] for i in range(0, len(x))]).reshape((-1, 1 ,2)).astype(np.int32))
    x_bar = m['m10']/m['m00']
    y_bar = m['m01']/m['m00']

    x_1 = np.array([i[0] for i in x])
    y_1 = np.array([i[0] for i in y])
    # take the centroid as the reference
    x = x_1 - x_bar
    y = y_1 - y_bar

    return np.sqrt(x*x + y*y)
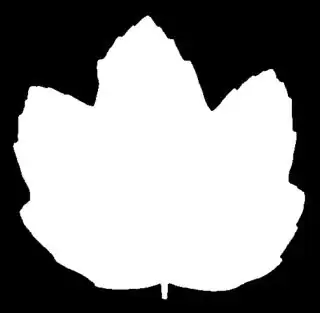
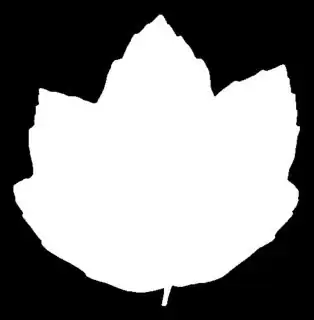
Here are the results of applying this for the following images that are similar in shape. Note that the images and plots have been rescaled.
filename = '19.jpg'
im = cv2.imread(filename, 0)

desc = shape_desc(im)
plt.stem(desc)