1

Since a couple of weeks, my reported uptimes for most of my pods are incorrect and reset to 0 frequently but at a random rate (sometimes it's reset after a couple of minutes/seconds, sometimes a couple of hours).

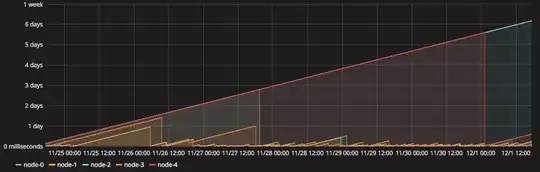
The data are sinked to influxdb and displayed with Grafana. Here is a screenshot of the uptime of some MongoDB nodes over a week (none of them have restarted). Only the blue line (node-2) is correct, all other are reset randomly.

grafana

Versions:

  • kubernetes: 1.8.3
  • heapster: 1.4.3 amd64
  • influxdb: 1.1.1 amd64

Any idea of what is going wrong?

Blackus
  • 6,883
  • 5
  • 40
  • 51
  • Try to look into the Pod's log for around the time the uptime was zero. I have noticed that Heapster does occasionally fail to retrieve some metrics when Pods are experiencing high loads. Perhaps look into Pod's CPU utilization also for such periods. – Khaled Dec 03 '17 at 14:50
  • Indeed there seems to be a correlation between uptime and CPU load, but it's probably not the only factor, as sometimes uptime reset with 400 millicores of CPU usage, sometimes it's okay with 5k. Thanks for the insight, I also opened an [issue on heapster repo](https://github.com/kubernetes/heapster/issues/1899). – Blackus Dec 04 '17 at 09:32

0 Answers0