I checked current memory behaviour for a Java application and I notice Garbage Collector initially rarely runs but in the long period it continues to run more often, even if I set no limits for max memory usage (server has 8Gb of free ram).
Initially GC runs once every 20 minutes and after 15 hours once a minute, but the application does the same thing and there are no spikes in RAM usage.
Continuing to run GC, it consumes more and more CPU and after 24 hours, CPU usage is at 85% and GC runs every 10 seconds.
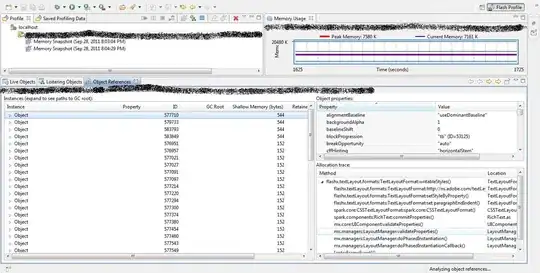
Here are snapshot of performances:
Jprofiler run for 14 hours

JvisualVM run for the last hour
JvisualVM - High CPU usage
Why GC starts even if memory is very low? It shouldn't start in these situations.
What could be the cause or what should I do to investigate this behaviour?