76

I have created a MATLAB plotting with the plot() function. How do I change the window title of the generated figure of the plotting?

My MATLAB m-file which I'm working on:

hold on

x = [0; 0.2; 0.4; 0.6; 0.8; 1; 1.2; 1.4; 1.6; 1.8; 2; 2.2; 2.4; 2.6; 2.8; 3; 3.2; 3.4; 3.6; 3.8; 4; 4.2; 4.4; 4.6; 4.8; 5; 5.2; 5.4; 5.6; 5.8; 6; 6.2; 6.4; 6.6; 6.8; 7; 7.2; 7.4; 7.6; 7.8; 8; 8.2; 8.4; 8.6; 8.8; 9; 9.2; 9.4; 9.6; 9.8; 10; 10.2; 10.4; 10.6; 10.8; 11; 11.2; 11.4; 11.6; 11.8; 12; 12.2; 12.4; 12.6; 12.8; 13; 13.2; 13.4; 13.6; 13.8; 14; 14.2; 14.4; 14.6; 14.8; 15; 15.2; 15.4; 15.6; 15.8; 16; 16.2; 16.4; 16.6; 16.8; 17; 17.2; 17.4; 17.6; 17.8; 18; 18.2; 18.4; 18.6; 18.8];
y = [0; 0.198669; 0.389418; 0.564642; 0.717356; 0.841471; 0.932039; 0.98545; 0.999574; 0.973848; 0.909297; 0.808496; 0.675463; 0.515501; 0.334988; 0.14112; -0.0583741; -0.255541; -0.44252; -0.611858; -0.756802; -0.871576; -0.951602; -0.993691; -0.996165; -0.958924; -0.883455; -0.772764; -0.631267; -0.464602; -0.279415; -0.0830894; 0.116549; 0.311541; 0.494113; 0.656987; 0.793668; 0.898708; 0.96792; 0.998543; 0.989358; 0.940731; 0.854599; 0.734397; 0.584917; 0.412118; 0.22289; 0.0247754; -0.174327; -0.366479; -0.544021; -0.699875; -0.827826; -0.922775; -0.980936; -0.99999; -0.979178; -0.919329; -0.822829; -0.693525; -0.536573; -0.358229; -0.165604; 0.033623; 0.23151; 0.420167; 0.592074; 0.740376; 0.859162; 0.943696; 0.990607; 0.998027; 0.965658; 0.894791; 0.788252; 0.650288; 0.486399; 0.303118; 0.107754; -0.0919069; -0.287903; -0.472422; -0.638107; -0.778352; -0.887567; -0.961397; -0.9969; -0.992659; -0.948844; -0.867202; -0.750987; -0.604833; -0.434566; -0.246974; -0.0495356];
plot(x, y, '--b');

x = [0; 0.2; 0.4; 0.6; 0.8; 1; 1.2; 1.4; 1.6; 1.8; 2; 2.2; 2.4; 2.6; 2.8; 3; 3.2; 3.4; 3.6; 3.8; 4; 4.2; 4.4; 4.6; 4.8; 5; 5.2; 5.4; 5.6; 5.8; 6; 6.2; 6.4; 6.6; 6.8; 7; 7.2; 7.4; 7.6; 7.8; 8; 8.2; 8.4; 8.6; 8.8; 9; 9.2; 9.4; 9.6; 9.8; 10; 10.2; 10.4; 10.6; 10.8; 11; 11.2; 11.4; 11.6; 11.8; 12; 12.2; 12.4; 12.6; 12.8; 13; 13.2; 13.4; 13.6; 13.8; 14; 14.2; 14.4; 14.6; 14.8; 15; 15.2; 15.4; 15.6; 15.8; 16; 16.2; 16.4; 16.6; 16.8; 17; 17.2; 17.4; 17.6; 17.8; 18; 18.2; 18.4; 18.6; 18.8];
y = [-1; -0.980133; -0.921324; -0.825918; -0.697718; -0.541836; -0.364485; -0.172736; 0.0257666; 0.223109; 0.411423; 0.583203; 0.731599; 0.850695; 0.935744; 0.983355; 0.991629; 0.960238; 0.890432; 0.784994; 0.648128; 0.48529; 0.302972; 0.108443; -0.0905427; -0.286052; -0.470289; -0.635911; -0.776314; -0.885901; -0.960303; -0.996554; -0.993208; -0.950399; -0.869833; -0.754723; -0.609658; -0.44042; -0.253757; -0.057111; 0.141679; 0.334688; 0.514221; 0.673121; 0.805052; 0.904756; 0.968256; 0.993023; 0.978068; 0.923987; 0.832937; 0.708548; 0.555778; 0.380717; 0.190346; -0.00774649; -0.205663; -0.395514; -0.56973; -0.721365; -0.844375; -0.933855; -0.986238; -0.999436; -0.972923; -0.907755; -0.806531; -0.673287; -0.513333; -0.333047; -0.139617; 0.0592467; 0.255615; 0.44166; 0.609964; 0.753818; 0.867487; 0.946439; 0.987526; 0.989111; 0.95113; 0.875097; 0.764044; 0.622398; 0.455806; 0.27091; 0.0750802; -0.123876; -0.318026; -0.499631; -0.66145; -0.797032; -0.900972; -0.969126; -0.998776];
plot(x, y, '-r');

hold off

title('My plot title');
xlabel('My x-axis title');
ylabel('My y-axis title');

Its output figure is:
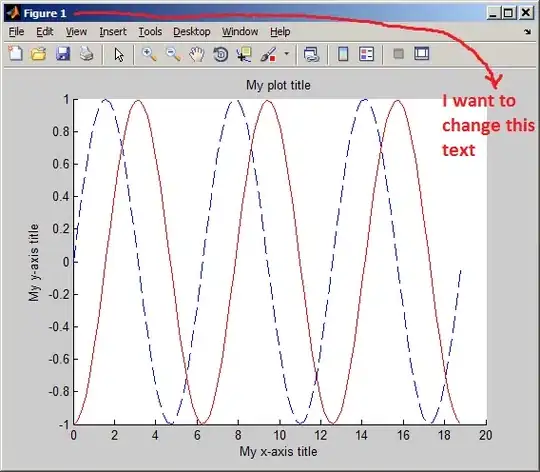
The figure which is generated by the code above.

How do I change the window title of this plot?

What command do I add, and/or what modifications should I do to change it?

Peter Mortensen
  • 30,738
  • 21
  • 105
  • 131
hkBattousai
  • 10,583
  • 18
  • 76
  • 124
  • 2
    By the way: It may be more convenient to define `x` as `0:0.2:18.8` and `y` as `sin(x)`. – Jonas Jan 13 '11 at 19:47
  • @Jonas: You are right, but in this case, the m-file is generated by a C++ code. The `sin()` function is used in C++ code. – hkBattousai Jan 13 '11 at 19:51
  • possible duplicate of [MATLAB: Setting window/picture title](http://stackoverflow.com/questions/3990951/matlab-setting-window-picture-title) – gnovice Apr 12 '11 at 03:48
  • in order to remove `Figure 1` check http://stackoverflow.com/a/10929129/3252535 – ironzionlion Jul 23 '14 at 15:08

4 Answers4

84

First you must create an empty figure with the following command.

figure('name','Title of the window here');

By doing this, the newly created figure becomes you active figure. Immediately after calling a plot() command, it will print your plotting onto this figure. So your window will have a title.

This is the code you must use:

figure('name','Title of the window here');

hold on

x = [0; 0.2; 0.4; 0.6; 0.8; 1; 1.2; 1.4; 1.6; 1.8; 2; 2.2; 2.4; 2.6; 2.8; 3; 3.2; 3.4; 3.6; 3.8; 4; 4.2; 4.4; 4.6; 4.8; 5; 5.2; 5.4; 5.6; 5.8; 6; 6.2; 6.4; 6.6; 6.8; 7; 7.2; 7.4; 7.6; 7.8; 8; 8.2; 8.4; 8.6; 8.8; 9; 9.2; 9.4; 9.6; 9.8; 10; 10.2; 10.4; 10.6; 10.8; 11; 11.2; 11.4; 11.6; 11.8; 12; 12.2; 12.4; 12.6; 12.8; 13; 13.2; 13.4; 13.6; 13.8; 14; 14.2; 14.4; 14.6; 14.8; 15; 15.2; 15.4; 15.6; 15.8; 16; 16.2; 16.4; 16.6; 16.8; 17; 17.2; 17.4; 17.6; 17.8; 18; 18.2; 18.4; 18.6; 18.8];
y = [0; 0.198669; 0.389418; 0.564642; 0.717356; 0.841471; 0.932039; 0.98545; 0.999574; 0.973848; 0.909297; 0.808496; 0.675463; 0.515501; 0.334988; 0.14112; -0.0583741; -0.255541; -0.44252; -0.611858; -0.756802; -0.871576; -0.951602; -0.993691; -0.996165; -0.958924; -0.883455; -0.772764; -0.631267; -0.464602; -0.279415; -0.0830894; 0.116549; 0.311541; 0.494113; 0.656987; 0.793668; 0.898708; 0.96792; 0.998543; 0.989358; 0.940731; 0.854599; 0.734397; 0.584917; 0.412118; 0.22289; 0.0247754; -0.174327; -0.366479; -0.544021; -0.699875; -0.827826; -0.922775; -0.980936; -0.99999; -0.979178; -0.919329; -0.822829; -0.693525; -0.536573; -0.358229; -0.165604; 0.033623; 0.23151; 0.420167; 0.592074; 0.740376; 0.859162; 0.943696; 0.990607; 0.998027; 0.965658; 0.894791; 0.788252; 0.650288; 0.486399; 0.303118; 0.107754; -0.0919069; -0.287903; -0.472422; -0.638107; -0.778352; -0.887567; -0.961397; -0.9969; -0.992659; -0.948844; -0.867202; -0.750987; -0.604833; -0.434566; -0.246974; -0.0495356];
plot(x, y, '--b');

x = [0; 0.2; 0.4; 0.6; 0.8; 1; 1.2; 1.4; 1.6; 1.8; 2; 2.2; 2.4; 2.6; 2.8; 3; 3.2; 3.4; 3.6; 3.8; 4; 4.2; 4.4; 4.6; 4.8; 5; 5.2; 5.4; 5.6; 5.8; 6; 6.2; 6.4; 6.6; 6.8; 7; 7.2; 7.4; 7.6; 7.8; 8; 8.2; 8.4; 8.6; 8.8; 9; 9.2; 9.4; 9.6; 9.8; 10; 10.2; 10.4; 10.6; 10.8; 11; 11.2; 11.4; 11.6; 11.8; 12; 12.2; 12.4; 12.6; 12.8; 13; 13.2; 13.4; 13.6; 13.8; 14; 14.2; 14.4; 14.6; 14.8; 15; 15.2; 15.4; 15.6; 15.8; 16; 16.2; 16.4; 16.6; 16.8; 17; 17.2; 17.4; 17.6; 17.8; 18; 18.2; 18.4; 18.6; 18.8];
y = [-1; -0.980133; -0.921324; -0.825918; -0.697718; -0.541836; -0.364485; -0.172736; 0.0257666; 0.223109; 0.411423; 0.583203; 0.731599; 0.850695; 0.935744; 0.983355; 0.991629; 0.960238; 0.890432; 0.784994; 0.648128; 0.48529; 0.302972; 0.108443; -0.0905427; -0.286052; -0.470289; -0.635911; -0.776314; -0.885901; -0.960303; -0.996554; -0.993208; -0.950399; -0.869833; -0.754723; -0.609658; -0.44042; -0.253757; -0.057111; 0.141679; 0.334688; 0.514221; 0.673121; 0.805052; 0.904756; 0.968256; 0.993023; 0.978068; 0.923987; 0.832937; 0.708548; 0.555778; 0.380717; 0.190346; -0.00774649; -0.205663; -0.395514; -0.56973; -0.721365; -0.844375; -0.933855; -0.986238; -0.999436; -0.972923; -0.907755; -0.806531; -0.673287; -0.513333; -0.333047; -0.139617; 0.0592467; 0.255615; 0.44166; 0.609964; 0.753818; 0.867487; 0.946439; 0.987526; 0.989111; 0.95113; 0.875097; 0.764044; 0.622398; 0.455806; 0.27091; 0.0750802; -0.123876; -0.318026; -0.499631; -0.66145; -0.797032; -0.900972; -0.969126; -0.998776];
plot(x, y, '-r');

hold off

title('My plot title');
xlabel('My x-axis title');
ylabel('My y-axis title');
Peter Mortensen
  • 30,738
  • 21
  • 105
  • 131
user575775
  • 856
  • 6
  • 2
43

You need to set figure properties.

At the very beginning of the script, call

figure('name','something else')

Calling figure is a good thing, anyway, because without it, you always plot into the same window, and sometimes you may want to compare two windows side-by-side.

Alternatively, you can store the figure's handle by calling

figH = figure;

so that you can later change the figure properties to your liking (the 'numberTitle' property setting eliminates the "figure X" text)

set(figH,'Name','something else','NumberTitle','off')

Have a look at the figure properties in the MATLAB documentation to see what else you can change if you want.

Peter Mortensen
  • 30,738
  • 21
  • 105
  • 131
Jonas
  • 74,690
  • 10
  • 137
  • 177
  • If I define two different figures by the `figure()`, in which figure my plotting will be drawn when I call `plot()`? – hkBattousai Jan 13 '11 at 19:47
  • 2
    @hkBattousai: in the currently active one (as identified by the command `gcf` which returns the handle to the current figure). Calling `figure` will make the just created figure active, so unless you click really fast on another figure, plot will plot in the right place. – Jonas Jan 13 '11 at 19:50
21

It can also be done this way:

figure(xx);
set(gcf, 'name', 'Name goes here')

gcf gets the current figure handle.

Prashant Kumar
  • 20,069
  • 14
  • 47
  • 63
user13267
  • 6,871
  • 28
  • 80
  • 138
1

If you do not want to include that your code script (as advised by others above), then simply you may do the following after generating the figure window:

  1. Go to "Edit" in the figure window

  2. Go to "Figure Properties"

  3. At the bottom, you can type the name you want in "Figure Name" field. You can uncheck "Show Figure Number".

That's all.

Good luck.

Darwind
  • 7,284
  • 3
  • 49
  • 48