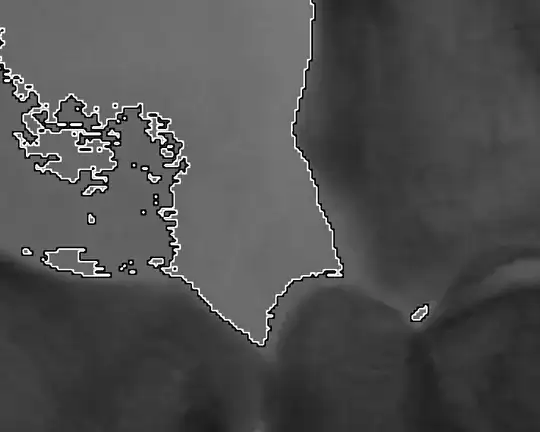
I'm trying to visually inspect, and extract, subsets of large heatmaps. For example, I'd like to roughly extract the row/col indices for clusters like the one I circled below:
Following the advice from here, I hope to achieve this by creating rectangles around subsets of cells by index and repeat until I've highlighted areas close enough to what I want.
Using some simpler data, I tried this:
    library(gplots)

    set.seed(100)

    # Input data 4x5 matrix
    nx <- 5
    ny <- 4
    dat <- matrix(runif(20, 1, 10), nrow=ny, ncol=nx)

    # Get hierarchically clustered heatmap matrix
    hm <- heatmap.2(dat, main="Test HM", key=T, trace="none")
    hmat <- dat[rev(hm$rowInd), hm$colInd]

    # Logical matrix with the same dimensions as our data
    # indicating which cells I want to subset
    selection <- matrix(rep(F,20), nrow=4)
    # For example: the third row
    selection[3,] <- T

    #selection <- dat>7 # Typical subsets like this don't work either

    # Function for making selection rectangles around selection cells
    makeRects <- function(cells){
      coords = expand.grid(1:nx,1:ny)[cells,]
      xl=coords[,1]-0.49
      yb=coords[,2]-0.49
      xr=coords[,1]+0.49
      yt=coords[,2]+0.49
      rect(xl,yb,xr,yt,border="black",lwd=3)
    }

    # Re-make heatmap with rectangles based on the selection
    # Use the already computed heatmap matrix and don't recluster
    heatmap.2(hmat, main="Heatmap - Select 3rd Row", key=T, trace="none",
      dendrogram="none", Rowv=F, Colv=F,
      add.expr={makeRects(selection)})
This does not work. Here is the result. Instead of the third row being highlighted, we see a strange pattern:
It must have to do with this line:
    coords = expand.grid(1:nx,1:ny)[cells,]
    # with parameters filled...
    coords = expand.grid(1:5,1:4)[selection,]
Can anyone explain what's going on here? I'm not sure why my subset isn't working even though it is similar to the one in the other question.


