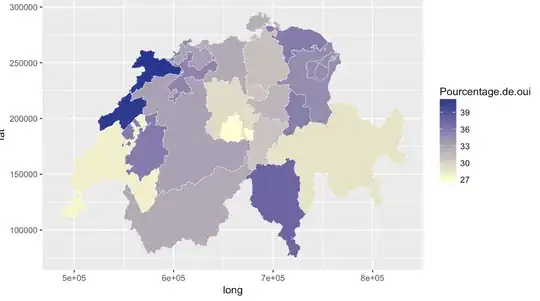
I am unable to subset a dataframe within a reactive shiny structure and display it as plot (using ggplot).  I want to have something with map like that, in my shiny app and of course to change the map with the "Choisir une votation"(refering to my input$objet)
  here is my ui.r
library(shiny)

 shinyUI(fluidPage(


 titlePanel("Swiss votations tool"),

 # Sidebar with a slider input for number of bins
 sidebarLayout(
 sidebarPanel(

        selectInput("objet", "Choisir une votation",
                    levels((df.merge$Date.et.objet))
        )
),

# Show a plot of the generated distribution
mainPanel(
 plotOutput("plot")
  )
)
))
and my server.r (i think i'm doing something with the reactive wrong and/or stupid here...)
shinyServer(function(input, output) {
   df.merge2<-reactive({
     df.merge2<-df.merge[input$objet,]
     d <- as.data.frame(df.merge2)
     d
      })

 output$plot <- renderPlot({

 df.merge2<-df.merge2()

 p <- ggplot() +geom_polygon(data=df.merge2,
    aes(fill =as.numeric(df.merge2$Pourcentage.de.oui),
    x = df.merge2$long, y = df.merge2$lat, group = df.merge2$group))
 p <- p+geom_path(data=df.merge2,
       aes(fill=as.numeric(df.merge2$Pourcentage.de.oui),x =
        df.merge2$long,  y = df.merge2$lat, group = df.merge2$group),
        color = "white", size = 0.1)
 p <- p+scale_fill_gradient(low ="#ffffcc" , high = "#253494")
 print(p)
   })

    })
Think you for help, I quite new to shiny
my data: dataframe with str(df.merge) 'data.frame': 156672 obs. of 26 variables: and geographic informations