So I have been trying to train an LSTM to predict the values of a certain stock. The error was pretty low, so I decided to create a graph out of the test set. It looked like this:
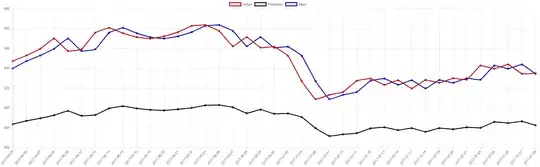 Red: actual, Black: my prediction, Blue: input to get prediction
So i'm training the network with datsets like: in: xt-1, out: xt. But when ignoring the fact that the black line is much lower than the red line, you'll see that the network is actually mimicking the input to stay as close to the actual prediction.
So after doing some googling, I found out that this is a common 'trap:
Is there anything I can do to fix this?
I'm using Stock.js for data and Neataptic for training.
I have created a JSFiddle with the training of the neural network and the chart. View it here (open console before opening). Feel free to tweak around with the options to see if you get something working...
Current options:
iterations: 5000,
rate: 1e-3,
cost: methods.cost.MSE,
clear: true,
log: 1000