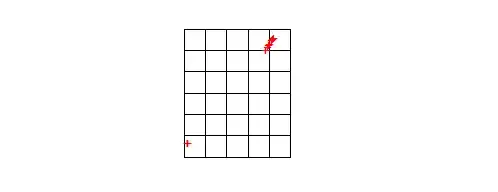
I have a dataset with the following coordinates:
lat <- c(-5.9, 35.9, 5.13, -3.4)
lon <- c(-19.9, -6, -39.9, 9.38)
So the latitude ranges from -5.9 – 35.9 whereas the longitude ranges from -39.9 – 9.38. The four lat/lot coordinates represent the area's boundaries (four corners).
What I would like to do is create a grid which splits/separates this range into 20 (or so) equal cells. I've tried the following method which splits the instances into equal parts and creates a new column assigning each split a number (1–20).
df$LAT_SPLIT <- NA
df$LAT_SPLIT <- as.numeric(cut2(df$LAT, g=20))
However, each split does not have the same coordinate range (degrees), which creates grids of different sizes. My question is, how would one separate the above coordinates to create a grid with equal cells, while creating a new column where each cell is assigned a number?
I've read different approaches such that each cell represents 1 degree change in latitude * 30 minutes of longitude but I'm not sure how to do that. I've tried to change the code above so that each degree change in latitude splits the latitude column but I couldn't quite figure out how to that that either, I believe you can use sequence? Even if I could get that to work, the longitude will still have different ranges..
I've tried this in R but any suggestions using Python are appreciated as well Really looking forward to any possible solutions, thanks!
Reproducible code
df <- structure(list(LAT = c(35.61226, 35.34986, 35.17794, 34.60425,34.40356, 33.94433, 33.41834, 16.89566, 16.89561, 16.89561),
                     LON = c(-9.604802, -9.803048, -9.921968, -10.30782, -10.44971,-10.76656, -11.13053, -24.99776, -24.99788, -24.99773)),
                     .Names = c("LAT","LON"), class = "data.frame", row.names = c(1L, 2L, 3L, 4L, 5L,6L, 7L, 44161L, 44162L, 44163L))

