-1

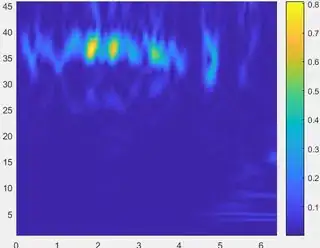
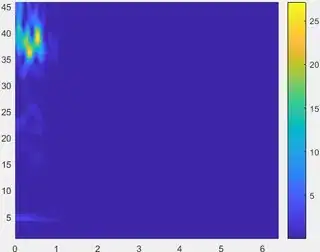
Whatever I tried I couldn't stabilize the colors of two diagrams. When the values decrease from 0 - 30 to 0-1 the colormap always adapts to new values. In the figures attached, I need to stabilize the first color scale 0-30, and second legend should by all dark blue as well as the surface.

Disregard the y-values.

0-30 0-1

Thank you so much for all your help and advices.

The partial code is below.

args = {time,freq,abs(cfs).^2}; 
surf(args{:},'edgecolor','none'); 
view(0,90); axis tight; 
shading interp; colormap(parula(128)); 
h = colorbar;  

I tried this but didn't work.

set(h,'ylim',[0 100]); 
yal=linspace(1,100);
set(h,'ytick',yal); 
m7913d
  • 10,244
  • 7
  • 28
  • 56
Droa
  • 3
  • 3
  • Can you put an example of the code you are using? Thanks! – Flynn Jul 26 '17 at 12:34
  • Welcome to Stack Overflow! Questions seeking debugging help ("why isn't this code working?") must include the desired behavior, a specific problem or error and the shortest code necessary to reproduce it in the question itself. Questions without a clear problem statement are not useful to other readers. See: How to create a [mcve]. Use the "edit" link to improve your *question* - do not add more information via comments. Thanks! – GhostCat Jul 26 '17 at 12:35

1 Answers1

2

Try adding this instead:

caxis([0 100]);

https://www.mathworks.com/help/matlab/ref/caxis.html

Flynn
  • 269
  • 2
  • 12