Some of the folks on my team, including myself, find it pretty disorienting that in a Bokeh scatter plot, say using the circle method, that for an initial autoscale fit of the data on the figure we can dial in a reasonable size for our data, using for example something like plot.circle( x , y , size=3 )
However when we interactively zoom into our data the glyph sizes as displayed are invariant to the zoom. Is there a way to have them scale proportionally to the zoom we've dialed into? Something akin to an vector graphics interaction (eg svg). If memory serves me right matlab figures and matplotlib figures should maintain zoom proportionality behavior. To demonstrate the behavior we're seeing consider the first image and the red box I approximately zoom into on the second image.
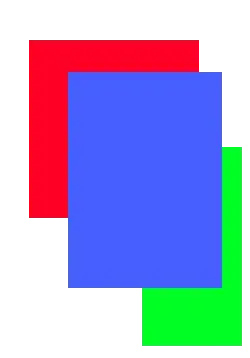
Just as a quick demo using Powerpoint to illustrate the sort of desired behavior...


