Use NMaximize
First approximation:
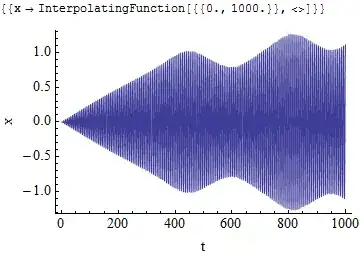
s = NDSolve[{x''[t] + x[t] - 0.167 x[t]^3 ==
            0.005 Cos[t + -0.0000977162*t^2/2], x[0] == 0, x'[0] == 0}, x[t],
            {t, 0, 1000}]
NMaximize[{Evaluate[x[t] /. s[[1]]] , 100 < t < 1000}, t]

{1.26625, {t -> 821.674}}
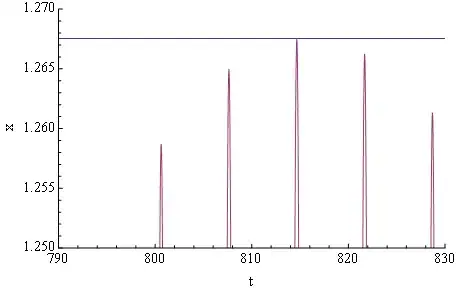
As your function is a rapid oscillation like this :  , it doesn't catch the real max value, as you may see below:
Plot[{1.26625, Evaluate[x[t] /. s[[1]]]}, {t, 790, 830},
 Frame -> {True, True, False, False}, FrameLabel -> {"t", "x"},
 FrameStyle -> Directive[FontSize -> 15], Axes -> False,
 PlotRange -> {{790, 830}, {1.25, 1.27}}]
So we refine our bounds, and tune a little the NMaximize function:
NMaximize[{Evaluate[x[t] /. s[[1]]] , 814 < t < 816}, t,
 AccuracyGoal -> 20, PrecisionGoal -> 18, MaxIterations -> 1000]

NMaximize::cvmit: Failed to converge to the requested accuracy or
                  precision within 1000 iterations. >>

{1.26753, {t -> 814.653}}
It failed to converge within the required accuracy, but now the result is good enough
Plot[{1.2675307922753962`, Evaluate[x[t] /. s[[1]]]}, {t, 790, 830},
 Frame -> {True, True, False, False}, FrameLabel -> {"t", "x"},
 FrameStyle -> Directive[FontSize -> 15], Axes -> False,
 PlotRange -> {{790, 830}, {1.25, 1.27}}]