14

Using autoplot from ggfortify to create diagnostic plots:

library(ggplot2)
library(ggfortify)

mod <- lm(Petal.Width ~ Petal.Length, data = iris)
autoplot(mod, label.size = 3)

Is it possible to change the axis and plot titles (easily)? I'd like to translate them.

enter image description here

erc
  • 10,113
  • 11
  • 57
  • 88

3 Answers3

8

The function autoplot.lm returns an S4 object (class ggmultiplot, see ?`ggmultiplot-class`). If you look at the helpfile, you'll see they have replacement methods for individual plots. That means you can extract an individual plot, modify it, and put it back. For example:

library(ggplot2)
library(ggfortify)

mod <- lm(Petal.Width ~ Petal.Length, data = iris)
g <- autoplot(mod, label.size = 3) # store the ggmultiplot object

# new x and y labels
xLabs <- yLabs <- c("a", "b", "c", "d")

# loop over all plots and modify each individually
for (i in 1:4)
    g[i] <- g[i] + xlab(xLabs[i]) + ylab(yLabs[i])

# display the new plot
print(g) 

Here I only modified the axis labels, but you change anything about the plots individually (themes, colors, titles, sizes).

Vandenman
  • 3,046
  • 20
  • 33
5
library(ggplot2)
library(ggfortify)

mod <- lm(Petal.Width ~ Petal.Length, data = iris)
autoplot(mod,which=c(1:6), ncols=2)    #total 6 plots in two columns
#change axes label & title of plot 1. similarly by changing 'which' parameters count you can label other plots.
autoplot(mod,which=1) + 
  labs(x="x-axis label of fig1", y="y-axis label of fig1", title="Fig1 plot")

Kindly don't forget to let us know if it helped :)

user20650
  • 24,654
  • 5
  • 56
  • 91
Prem
  • 11,775
  • 1
  • 19
  • 33
  • This works well for a single plot, but as each plot has to be created separately, how to combine them? neither `grid.arrange` nor `cowplot`'s `plot_grid` work due to the class of the `autoplot` object. – erc Jul 24 '17 at 10:55
  • 3
    @beetroot ; you could loop through the figures customising labels. `m <- mapply(function(w, x, y, z) autoplot(mod, which=w) + labs(x=x, y=y, title=z), w=1:6, x=paste0("x", 1:6), y=paste0("y", 1:6), z=paste0("tit", 1:6))`. There is probably a more simple way to combine them, but this seems to work : `l <- do.call(c, lapply(m, function(x) x@plots)) ; gridExtra::grid.arrange(grobs=l, ncol=2)` – user20650 Jul 24 '17 at 12:07
  • 2
    seems you can also do `p[1,1] <- p[1,1] + labs(x="x-axis label of fig1", y="y-axis label of fig1", title="Fig1 plot")`, which maybe gives another route (p is the original autoplot) – user20650 Jul 24 '17 at 12:21
5

The solutions proposed by @user20650 are interesting and elegant.

Here is a less elegant solution based on myautoplot, a modified version of autoplot. I hope it can help you.
Download the myautoplot funtion here and save it in your working directory with the name myautoplot.r.
Then, use the following code:

library(ggplot2)
library(ggfortify)

source("myautoplot.r")
mod <- lm(Petal.Width ~ Petal.Length, data = iris)

####
# Define x-labels, y-labels and titles
####
# Residuals vs Fitted Plot
xlab_resfit <- "Xlab ResFit"
ylab_resfit <- "Ylab ResFit"
title_resfit <- "Title ResFit"

# Normal Q-Q Plot
xlab_qqplot <- "Xlab QQ"
ylab_qqplot <- "Ylab QQ"
title_qqplot <- "Title QQ"

# Scale-Location Plot
xlab_scaleloc <- "Xlab S-L"
ylab_scaleloc <- "Ylab S-L"
title_scaleloc <- "Title S-L"

# Cook's distance Plot
xlab_cook <- "Xlab Cook"
ylab_cook <- "Ylab Cook"
title_cook <- "Title Cook"

# Residuals vs Leverage Plot
xlab_reslev <- "Xlab Res-Lev"
ylab_reslev <- "Ylab Res-Lev"
title_reslev <- "Title Res-Lev"

# Cook's dist vs Leverage Plot
xlab_cooklev <- "Xlab Cook-Lev"
ylab_cooklev <- "Ylab Cook-Lev"
title_cooklev <- "Title Cook-Lev"

# Collect axis labels and titles in 3 lists    
xlab_list <- list(resfit=xlab_resfit, qqplot=xlab_qqplot, 
      scaleloc=xlab_scaleloc, cook=xlab_cook, reslev=xlab_reslev,
      cooklev=xlab_cooklev)
ylab_list <- list(resfit=ylab_resfit, qqplot=ylab_qqplot, 
      scaleloc=ylab_scaleloc, cook=ylab_cook, reslev=ylab_reslev,
      cooklev=ylab_cooklev)
title_list <- list(resfit=title_resfit, qqplot=title_qqplot, 
      scaleloc=title_scaleloc, cook=title_cook, reslev=title_reslev,
      cooklev=title_cooklev)

# Pass the lists of axis labels and title to myautoplot
myautoplot(mod, which=1:6, xlab=xlab_list, 
                           ylab=ylab_list, 
                           title=title_list)
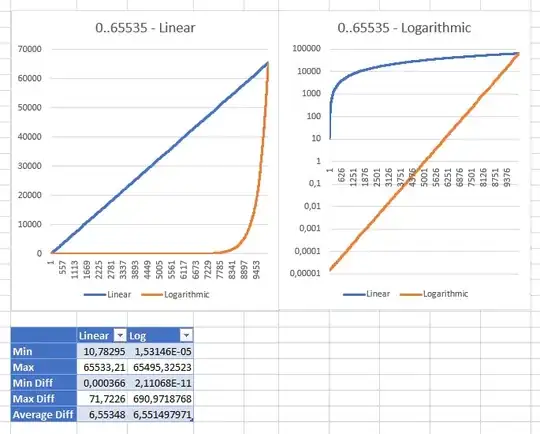
enter image description here

Marco Sandri
  • 23,289
  • 7
  • 54
  • 58