An alternative to sm.density is to evaluate the density on a finer grid than default, and use approx or approxfun to give the interpolated values of the density at the Returns you want. Here is an example with dummy data:
set.seed(1)
foo <- data.frame(Date = seq(as.Date("2010-01-01"), as.Date("2010-12-31"),
                             by = "days"),
                  Returns = rnorm(365))
head(foo)
## compute the density, on fin grid (512*8 points)
dens <- with(foo, density(Returns, n = 512 * 8))
At this point, we could use approx() to interpolate the x and y components of the returned density, but I prefer approxfun() which does the same thing, but returns a function which we can then use to do the interpolation. First, generate the interpolation function:
## x and y are components of dens, see str(dens)
BAR <- with(dens, approxfun(x = x, y = y))
Now you can use BAR() to return the interpolated density at any point you wish, e.g. for the first Returns:
> with(foo, BAR(Returns[1]))
[1] 0.3268715
To finish the example, add the density for each datum in Returns:
> foo <- within(foo, Density <- BAR(Returns))
> head(foo)
        Date    Returns   Density
1 2010-01-01 -0.6264538 0.3268715
2 2010-01-02  0.1836433 0.3707068
3 2010-01-03 -0.8356286 0.2437966
4 2010-01-04  1.5952808 0.1228251
5 2010-01-05  0.3295078 0.3585224
6 2010-01-06 -0.8204684 0.2490127
To see how well the interpolation is doing, we can plot the density and the interpolated version and compare. Note we have to sort Returns because to achieve the effect we want, lines needs to see the data in increasing order:
plot(dens)
with(foo, lines(sort(Returns), BAR(sort(Returns)), col = "red"))
Which gives something like this:
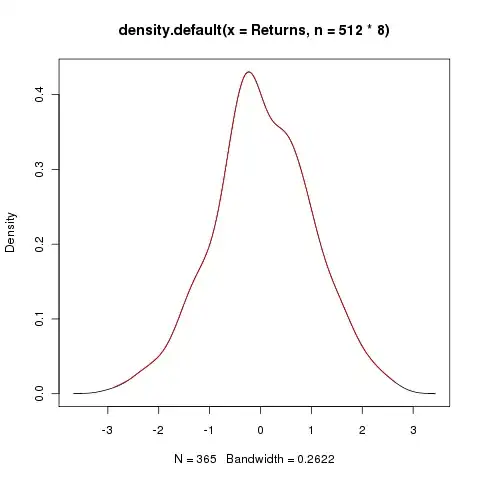
As long as the density is evaluated at sufficiently fine a set of points (512*8 in the above example) you shouldn't have any problems and will be hard pushed to tell the difference between the interpolated version and the real thing. If you have "gaps" in the values of your Returns then you might find that, as lines() just joins the points you ask it to plot, that straight line segments might not follow the black density at the locations of the gaps. This is just an artefact of the gaps and how lines() works, not a problem with the interpolation.