Hopefully this is an easy one. I have a series of charts in MS Excel that point to data on the same worksheet. The data on the worksheet is calculated using a VBA function. When the data is updated by the VBA function the new numbers are not reflected in the charts that are pointing to them. I tried calling Application.Calculate, but that didn't do the trick. Any thoughts?
UDPATE:
I was able to duplicate this issue on a much smaller scale. Here's how:
- Create a new workbook
- Rename Sheet 1 to "Summary"
- Rename Sheet 2 to "Data"
Open the Summary sheet in the VBA editor and paste the following code:
Private Sub Worksheet_Change(ByVal Target As Range)
   If Target.Parent.Range("worksheetDate") = Target Then
      Application.CalculateFull
   End If
End Sub
Create a new VBA module
Paste the following code into the new VBA module (I apologize - I can't get Stack Overflow to format this correctly for the life of me - this is the best I could get it to do):
.Function getWeekValue (weekNumber As Integer, valuesRange As Range) As Integer Dim aCell As Range Dim currentDate As Date Dim arrayIndex As Integer Dim weekValues(1 To 6) As Integer currentDate = ThisWorkbook.Names("worksheetDate").RefersToRange.Value arrayIndex = 1 For Each aCell In valuesRange If month(currentDate) = month(ThisWorkbook.Sheets("Data").Cells( _ aCell.Row - 1, aCell.Column)) Then weekValues(arrayIndex) = aCell.Value arrayIndex = arrayIndex + 1 End If Next getWeekValue = weekValues(weekNumber) End Function.
Modify the Data worksheet to match the following image:

- Select Cell B1 and name the range "worksheetDate"
- Duplicate rows 1 through 3 in the following image:
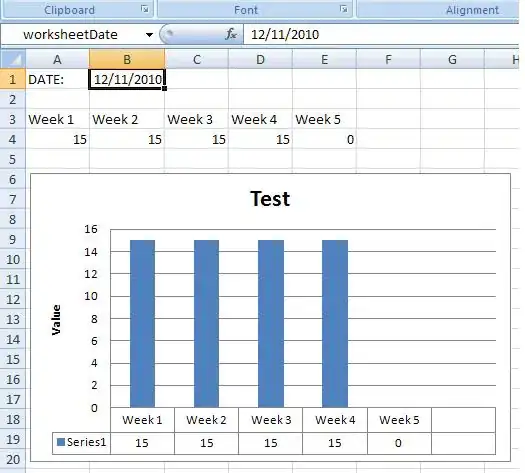
- In row 4, under the "Week X" headers, enter the following formula
.
= getWeekValue(1, Data!$A$2:$M$2)
incrementing the first argument to the getWeekValue function by one for each week (e.g., pass 1 for Week 1, 2 for Week 2, 3, for Week 3, etc.
- Create a bar graph using cells A3 through E4 as the data
- Change the date in cell B2 to a date between 10/1/2010 and 12/31/2010, choosing a month other than the month that is currently in the cell. For example, if the date is 12/11/2010, change it to something like 11/11/2010 or 10/11/2010. Note that both the data and chart update correctly.
- Modify the date in cell B2 gain. Note that the data updates, but the chart does not.
Oddly, after a period of time (several minutes) has elapsed, the chart finally updates. I'm not sure if this is because I have been performing other activities that triggered the update or because Excel is triggering an update after several minutes.
