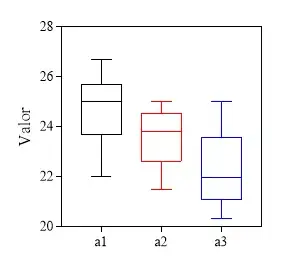
I'm new in R. Before using R, I used GraphPad Prism 7.0. Só now I'm trying to compare both as data processors. I founded a difference in the quantile calculations, so anyone know why they are differents??
In R i have
par(pty="s", cex.axis=1, las=1, cex.lab=1)
a1=c(22.02, 23.83,  26.67,  25.38,  25.49,  23.50,  25.90,  24.89, 25)
a2=c(21.49, 22.67,  24.62,  24.18,  22.78,  22.56,  24.46,  23.79, 25)
a3=c(20.33, 21.67,  24.67,  22.45,  22.29,  21.95,  20.49,  21.81, 25)
boxplot(a1,a2,a3, names=c("a1","a2","a3"), ylab="Valor", ylim=c(20,28))
And the quantiles for a3 are
quantile(a3)
   0%   25%   50%   75%  100%
20.33 21.67 21.95 22.45 25.00
Plotting the same data in GraphPad Prism:
Graph Family: Column Box & whiskers Plot: tukey
I get
And the quantiles are
Why they are differents (Particulary a3)??
Why R recognize 4 outliers in a3 and GraphPad does not?
Suggestions??


