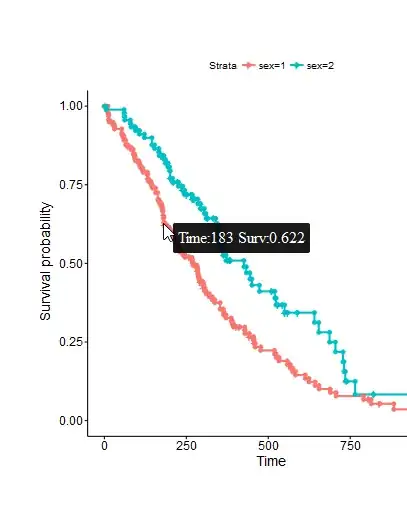
I wanted to add tooltip to ggsurvplot. I am using ggiraph to display the plot. Since ggiraph does not have geom_step_interactive, I am manipulating my the data output of ggsurvplot to get the step function values and using geom_line_interactive to overlay a line on my ggsurvplot and add a tooltip. Here is the code that is working correctly:
library(ggiraph)
library(survminer)
library(survival)

  #Function to get the step function points
  step_func <- function(data, direction="hv", x , y) {
    direction <- match.arg(direction, c("hv", "vh"))
    data <- as.data.frame(data)[order(data[, x]), ]
    n <- nrow(data)

    if (n <= 1) {
      # Need at least one observation
      return(data[0, , drop = FALSE])
    }

    if (direction == "vh") {
      xs <- rep(1:n, each = 2)[-2*n]
      ys <- c(1, rep(2:n, each = 2))
    } else {
      ys <- rep(1:n, each = 2)[-2*n]
      xs <- c(1, rep(2:n, each = 2))
    }

    return(data.frame(
      x = data[,x][xs],
      y = data[,y][ys],
      data[xs, setdiff(names(data), c(x, y))]
    ))
  }


  fit<- survfit(Surv(time, status) ~ sex, data = lung )
  g <- ggsurvplot(fit, data = lung, risk.table = TRUE,
                  risk.table.pos= "out", risk.table.y.text = TRUE)

  dat1 <- plyr::ddply(g$plot$data, "strata", step_func, "hv", "time", "surv")
  dat1$tooltip <- paste0("Time:", dat1$x)
  gg<- g$plot+geom_line_interactive(data = dat1, aes(x= x, y=y, colour = strata, tooltip= tooltip ), size = .75)
  ggiraph(code = print(gg))
With the above code I get the following plot with tooltip as displayed in the image:
I want the tooltip not only show the time but also the survival probability, for that I change the code slightly as follows:
dat1$tooltip <- paste0("Time:", dat1$x, "Surv:", dat1$y )
This causes the tooltip to disappear.
What am I doing wrong?
