I am creating a Dashboard from Splunk log

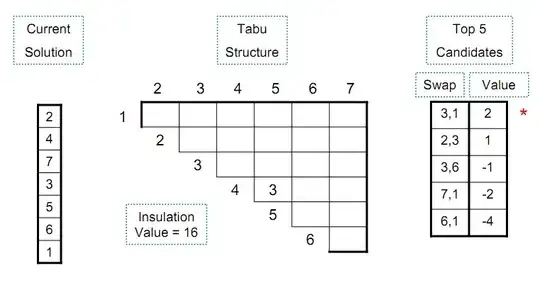
In this dashboard, I want to want to add the filter to each column. Just by writing into filter text box, data need to be filtered. something like this.
Here is source detail
<dashboard>
  <label>dataReportTable</label>
  <row>
    <panel>
      <table>
        <search>
          <query>index=_internal sourcetype=splunkd source="D:\\Software\\var\\log\\splunk\\splunkd.log"|
dedup _time, message | table _time, message</query>
          <earliest>-24h@h</earliest>
          <latest>now</latest>
          <sampleRatio>1</sampleRatio>
        </search>
        <option name="count">20</option>
        <option name="dataOverlayMode">none</option>
        <option name="drilldown">none</option>
        <option name="percentagesRow">false</option>
        <option name="rowNumbers">false</option>
        <option name="totalsRow">false</option>
        <option name="wrap">true</option>
      </table>
    </panel>
  </row>
</dashboard>
