0

For my program I'm attempting to have the user input attributes of a cantilever beam and from their input the program would output a shear diagram. I'm starting off simple with a singular downward load (user inputs point on beam where this load occurs and the load value). I figured a piecewise function sort of setup would work, so here is my code below:

length = input("input the length of your beam: ")
load = input("input your load: ")
distl = input("input the distance from the wall where your load starts: ")
distr = input("input the disance from the wall where your load ends: ")

load = float(load)
load = -load

length = int(length)
distl = int(distl)
distr = int(distr)


i = 0
graph = [0, 0, 0, 0, 0, 0, 0, 0, 0, 0, 0]
while i<=length:

    if  distl < i < distr:
            graph[i] = load 
    else:
        graph[i] = 0

    i = i +1


plt.ylabel('Shear (V(x))')
plt.xlabel('x (meters)')
plt.plot(graph)
plt.show()

This ends up outputting the graph below: enter image description here

Can someone explain to me why this includes a slope and not simply a jump? Thanks.
Kelsey W.
  • 1
  • 1
  • You can't. But you can do a ton more data points so the line will look vertical to your eyes – JBernardo May 11 '17 at 19:51
  • @JBernardo well it is often difficult to achieve vertical appearance in the face of pixelization. `matplotlib.pyplot.step` does plot vertical line segments, `matplotlib.pyplot.plot` can be used to plot arbitrary lines segments. – tiwo May 12 '17 at 09:39

2 Answers2

2

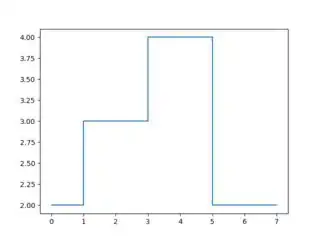
(Update:) Maybe you're looking for matplotlib.pyplot.step(X, Y, ...):

>>> import matplotlib.pyplot as plt
>>> X = range(8)
>>> Y = [2, 2, 3, 3, 4, 4, 2, 2]
>>> plt.step(X, Y)
[<matplotlib.lines.Line2D object at 0x000004124CEC0090>]
>>> plt.show()

matplotlib "step" plot


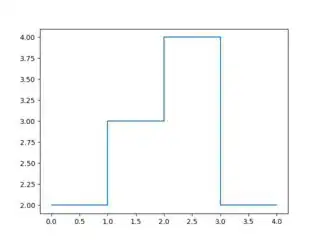
It is possible to explicitely request vertical lines by giving, for each point, both Y and Y coordinates:

>>> X = [0, 1, 1, 2, 2, 3, 3, 4]
>>> Y = [2, 2, 3, 3, 4, 4, 2, 2]
>>> plt.plot(X, Y)
[<matplotlib.lines.Line2D object at 0x000004124CEC0090>]
>>> plt.show()

matplotlib plot with jumps

To plot only horizontal lines or only vertical lines, use matplotlib's hlines or vlines, respectively.

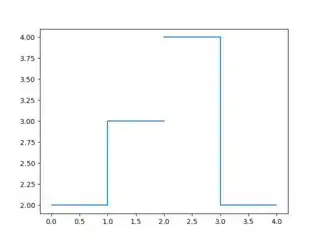
Want to avoid drawing a line segment? NaN's aren't connected:

>>> X = [0, 1, 1, 2,      2,       2, 3, 3, 4]
>>> Y = [2, 2, 3, 3, float('NaN'), 4, 4, 2, 2]
>>> plt.plot(X, Y)
[<matplotlib.lines.Line2D object at 0x0000016250A0C060>]
>>> plt.show()

matplotlib plot with jumps with and without vertical lines


To answer why the line segments are, by default, not vertical: Because piecewise linear graphs approximate real-life functions much better than piecewise constant graphs (visually).

Compare Cosine approximated by linear segments vs. Cosine approximated by step function

tiwo
  • 3,238
  • 1
  • 20
  • 33
0

Can someone explain to me why this includes a slope and not simply a jump?

Because (in your graph) at x=2 the shear value is 0, and at x=3 it is -4. The only way to connect it is with a "slope" line - the hypotenuse, where the changes in x and the shear value are the two other sides of the triangle.

For that line to be vertical, the shear had to be simultaneously with value 0 and -4 at x=2, which is impossible (in non-quantum physics :D).

As rightfully pointed out in the comments, for that line to appear as vertical, you have to increase the resolution - have a lot more x data points.

Todor Minakov
  • 19,097
  • 3
  • 55
  • 60