2

I tried tracking custom metrics with and without flushing it. However, the metrics only intermittently shows up in Application Insights under the "Custom" section. First question: Is it required to run "flush()" after every single "TrackMetric(metric)" call in order for the telemetry to be sent to Application Insights? Second: Why is there this intermittent behavior? I'm only writing one metric at a time, so it's not as if I'm overloading Application Insights with thousands of separate calls. Here is my code (This is from a simple Console App):

    public class Program
{
    public static void Main(string[] args)
    {
        var telemetryClient = new TelemetryClient()
        {
            Context = { InstrumentationKey = "{{hidden instrumentation key}}" }
        };
        var metric = new MetricTelemetry
        {
            Name = "ImsWithContextMetric2",
            Sum = 42.0
        };
        telemetryClient.TrackMetric(metric);
        telemetryClient.Flush();
    }
}

I'm also getting this strange behavior in Application Insights in which the custom metric I add shows up under a "Unavailable/deprecated Metrics" section. And a metric that I didn't even add called "Process CPU (all cores)" pops up under the "Custom" section. Any ideas why this strange behavior would occur?:

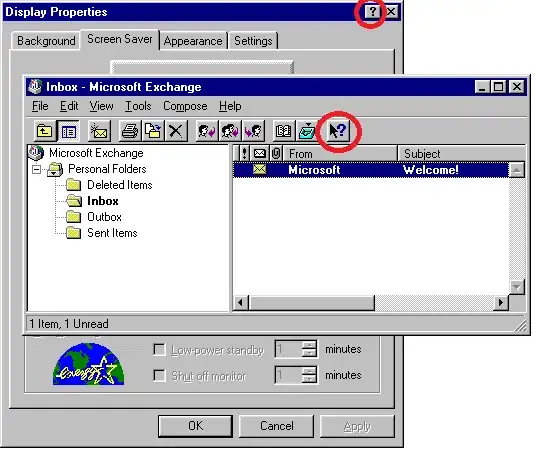
enter image description here

TheDude
  • 1,421
  • 4
  • 29
  • 54

1 Answers1

2

Is it required to run "flush()" after every single "TrackMetric(metric)" call in order for the telemetry to be sent to Application Insights?

Since you are using a Console Application to send events to Application Insights, which might be short-lived, it is definitely a good practice to call .Flush() every once in a while. The SDK uses the InMemoryChannel to send telemetry and sends it in batches using from an in-memory queue. So it is very important to call the .Flush() so that the data is forcefully pushed. A good practice might be to add a bit of wait after the event:

telemetryClient.Flush();
Thread.Sleep(1000);

More reading: Flushing data, Ensure you don't lose telemetry

However, the metrics only intermittently shows up in Application Insights under the "Custom" section. Why is there this intermittent behavior? I'm only writing one metric at a time, so it's not as if I'm overloading Application Insights with thousands of separate calls.

Sometimes there is a delay in metrics showing up in the Azure Portal. It can be up to a few minutes too. But if you have set it up correctly, you aren't exceeding the throttling limit, and adaptive sampling is disabled, then there is no reason for which telemetry should be intermittent. However if you still feel something is wrong, start a fiddler trace (make sure you are capturing from non-browser sessions) and check if a call is going out to dc.services.visualstudio.com. Make sure the response is 200 OK and if the items were accepted by the server.

I'm also getting this strange behavior in Application Insights in which the custom metric I add shows up under a "Unavailable/deprecated Metrics" section.

What version of the SDK are you using? I just tried out the same scenario and the custom metrics are showing up correctly.

And a metric that I didn't even add called "Process CPU (all cores)" pops up under the "Custom" section.

"Process CPU" is a performance counter which is used to track CPU utilization. I believe the SDK will only be able to track these counters if the app is running under IIS or on Azure. It probably got added internally when you created your Application Insights resource. You can ignore it since it won't have data to chart.

Hope this helps!

wablab
  • 1,703
  • 13
  • 15
degant
  • 4,861
  • 1
  • 17
  • 29
  • Thanks for the response. In answer to your question, I'm using the latest available version of the Microsoft.ApplicationInsights library which is 2.3. Also, do I need to run sleep for about a minute or so after I call "flush()" in the Console in order to ensure it works consistently? – TheDude May 04 '17 at 21:32
  • Also, what is "Adaptive Sampling" and how do I turn that off? Is that disabled by default? – TheDude May 04 '17 at 21:35
  • Yes, you should add a `Thread.Sleep()` after flushing the buffer. I added a few more references in the answer. You don't have to worry about adaptive sampling for your app, it wouldn't be enabled by default since it's not a web app. You can read more about ways to do it [here](https://learn.microsoft.com/en-us/azure/application-insights/app-insights-sampling). I just wanted to call it as a probable cause. Regarding the 'Unavailable/deprecated metrics' issue, I suggest you open an issue [here](https://github.com/Microsoft/ApplicationInsights-dotnet-logging/issues) – degant May 04 '17 at 21:53
  • Perfect. Thanks for the help! – TheDude May 04 '17 at 21:56