1

I would like to build some plotmath expressions and some string programmatically. The expressions and strings (in other words, the desired output) are

k[xy[2]]
k[xy[5]]
k[xy[7]]
k[xy[9]]    
k[xy[11]]
k[xy[13]]
K[xx[2]]
K[xx[5]]
K[xx[7]]
K[xx[9]]    
K[xx[11]]
K[xx[13]]
C[xx[2]]
C[xx[5]]
C[xx[7]]
C[xx[9]]    
C[xx[11]]
C[xx[13]]
"k_xy_2"
"k_xy_5"
"k_xy_7"
"k_xy_9"
"k_xy_11"
"k_xy_13"
"Kxx_2"
"Kxx_5"
"Kxx_7"
"Kxx_9"
"Kxx_11"
"Kxx_13"
"Cxx_2"
"Cxx_5"
"Cxx_7"
"Cxx_9"
"Cxx_11"
"Cxx_13"

You see they're quite a lot, so instead than hard-coding them (and repeat many lines of code, against the DRY directive) I'd rather build them programmatically. Building the strings is easy (but if you have a better/faster idea, I'm all ears):

for (i in c(2,5,7,9,11,13)) { 

    for (var in c("k_xy", "Kxx", "Cxx")) {
            print(paste0(var,i))
    }

}

However, how do I build the plotmath expressions? I thought of using bquote, but it's giving me an headache:

for (i in c(2,5,7,9,11,13)) { 

    for (var in list(c("k_","xy"), c("K","xx"), c("C","xx"))) {
        print(paste0(var[1],var[2],i))
        print(bquote(.(var[1])[.(var[2])[.(i)]]))
    }

} 

Output:

[1] "k_xy2"
"k_"["xy"[2]]
[1] "Kxx2"
"K"["xx"[2]]
[1] "Cxx2"
"C"["xx"[2]]
[1] "k_xy5"
"k_"["xy"[5]]
[1] "Kxx5"
"K"["xx"[5]]
[1] "Cxx5"
"C"["xx"[5]]
[1] "k_xy7"
"k_"["xy"[7]]
[1] "Kxx7"
"K"["xx"[7]]
[1] "Cxx7"
"C"["xx"[7]]
[1] "k_xy9"
"k_"["xy"[9]]
[1] "Kxx9"
"K"["xx"[9]]
[1] "Cxx9"
"C"["xx"[9]]
[1] "k_xy11"
"k_"["xy"[11]]
[1] "Kxx11"
"K"["xx"[11]]
[1] "Cxx11"
"C"["xx"[11]]
[1] "k_xy13"
"k_"["xy"[13]]
[1] "Kxx13"
"K"["xx"[13]]
[1] "Cxx13"
"C"["xx"[13]]

Not what I wanted, clearly. Any better idea? PS don't feel forced to follow my ugly code, only thing I care about is the output.

EDIT I was suggested to just parse the strings, but I'm not sure what it means. I need the plotmath to build labels for my plots: the strings are not good for this, but they're good to build the names of the files where I save the plots (so this is why I need both plotmath expressions AND strings). Example: this is fine

plot(0, xlab = expression(k[xy[13]]))

enter image description here

But this is not:

plot(0, xlab = expression("k_xy_13"))
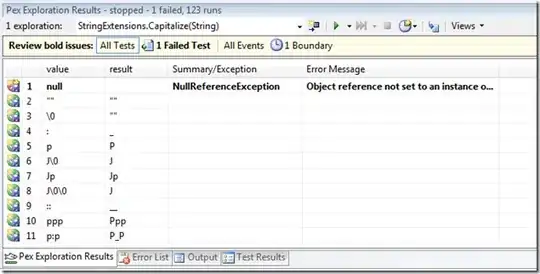
enter image description here

DeltaIV
  • 4,773
  • 12
  • 39
  • 86
  • If you can build the character strings it might be most easiest for you to simply parse them. – Roland Apr 21 '17 at 11:03
  • @Roland thanks for the tip, what do you mean by parsing them? I need `plotmath` expressions to build labels for my plots. Just the strings are not enough: see edit. I need also the strings, but for another goal (build names for the files storing the files). – DeltaIV Apr 21 '17 at 11:41
  • See help("parse"). – Roland Apr 21 '17 at 17:53

1 Answers1

1

Build an expression vector:

expr <- vector(length = 3, mode = "expression")
expr[[1]] <- quote(k[xy[.(i)]])
expr[[2]] <- quote(K[xx[.(i)]])
expr[[3]] <- quote(C[xx[.(i)]])

The number indices:

nums <- c(2,5,7,9,11,13)

Loop to apply bquote. We use some do.call magic to substitute the expressions:

plotexpr <- mapply(function(e, i) do.call(bquote, list(e)), 
                   rep(expr, each = length(nums)), nums)

Show the result:

plot.new()
plot.window(c(0.4, 0.6), c(-0.5, 0.5))
for (i in seq_along(plotexpr)) 
  text(0.5, -0.5 + 0.05 * i, plotexpr[[i]])

resulting plot

Efficient vectorized way for creating the character strings:

do.call(paste0, 
        expand.grid(c(2,5,7,9,11,13), c("k_xy_", "Kxx_", "Cxx_"))[, 2:1])
 #[1] "k_xy_2"  "k_xy_5"  "k_xy_7"  "k_xy_9"  "k_xy_11" "k_xy_13" "Kxx_2"   "Kxx_5"  
 #[9] "Kxx_7"   "Kxx_9"   "Kxx_11"  "Kxx_13"  "Cxx_2"   "Cxx_5"   "Cxx_7"   "Cxx_9"  
#[17] "Cxx_11"  "Cxx_13" 
Roland
  • 127,288
  • 10
  • 191
  • 288
  • nice! Two questions: 1. why not defining `expr` directly as a list, instead than having to use `list(e)` inside `do.call`? Any specific reason? 2. can you explain me the vectorized code for creating the character strings? What is `expand.grid` creating, a matrix? Then what are the arguments of `paste0`? And why the subsetting `[, 2:1]`? – DeltaIV Apr 24 '17 at 18:46
  • 1
    1. Wouldn't work. `mapply` extracts the list elements. 2. Study `help("expand.grid")` and `help("do.call")`. Keep in mind that a data.frame is "just" a list with a class attribute. The subsetting just inverts the column order. – Roland Apr 25 '17 at 06:56
  • ok thanks. Since you talk about efficiency, do you believe that `apply` & `do.call` functions are faster than `for` loops? I used to think the same, but I've been told that, unless I make real noob mistakes, such as growing objects inside loops, [that's not the case anymore](http://stackoverflow.com/questions/42673081/improve-this-code-by-eliminating-nested-for-cycles). Or do you mean that one `do.call` with a vectorized `paste0` is faster than two nested `for` loops? I could check with `microbenchmark`, but I don't have access to R now. – DeltaIV Apr 25 '17 at 08:49
  • Sure, you could use a `for` loop instead of `mapply` without loss of efficiency. I find `mapply` more readable and easier to write. The `*apply` functions were created to make functional programming easier and not for efficiency. `do.call` is not a loop and vectorized functions are faster than R-level loops. – Roland Apr 25 '17 at 10:26