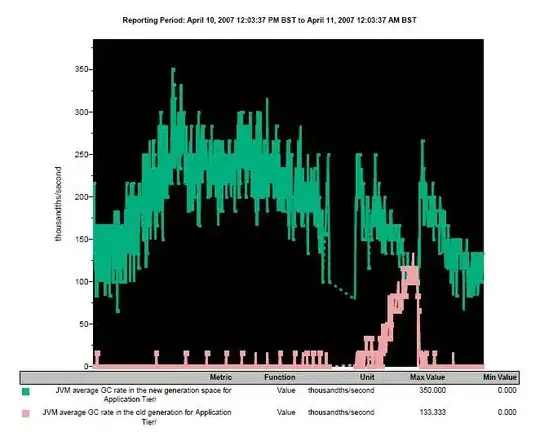
I want to set individual bar color of bar chart in excel using epplus. Please see the below code.
ExcelWorksheet wsGraph = pck.Workbook.Worksheets.Add("Graph");
wsGraph.Cells["D2"].LoadFromDataTable(dtGraph, true);
ExcelBarChart chat =(ExcelBarChart) wsGraph.Drawings.AddChart("Status", eChartType.BarClustered);
chat.Title.Text= "Tickets Status";
chat.SetPosition(1, 0, 3, 0);
chat.SetSize(500, 300);
chat.Series.Add(wsGraph.Cells["E3:E8"], wsGraph.Cells["D3:D8"]);
I want to this type chart.Also set series gap and bar height and width.

