From an N x 3 matrix with values in third column only having the 4 values 1, 2, 3 & 4, I have to create a bar plot as well as a line plot showing the growth rate for each row (second column values). First row values are called 'Temperature', second 'Growth rate' and third 'Bacteria type'
As of right now my line plot does not work when removing rows with one of the four values in the third column. The matrix could look something like this
   39.1220    0.8102    1.0000
   13.5340    0.5742    1.0000
   56.1370    0.2052    1.0000
   50.0190    0.4754    1.0000
   24.2970    0.8615    1.0000
   37.1830    0.8513    1.0000
   59.2390    0.0584    1.0000
   45.7840    0.6254    1.0000
   51.9480    0.3932    1.0000
   42.3400    0.7371    1.0000
   25.3870    0.8774    1.0000
   57.1870    0.3880    2.0000
   37.4580    0.7095    2.0000
   46.4190    0.6431    2.0000
   38.8380    0.7034    2.0000
   11.2930    0.1214    2.0000
   32.3270    0.6708    2.0000
   42.3150    0.6908    2.0000
   36.0600    0.7049    2.0000
   28.6160    0.6248    2.0000
   56.8570    0.3940    2.0000
   51.4770    0.5410    2.0000
   52.4540    0.5127    2.0000
   28.6270    0.6248    2.0000
   39.6590    0.7021    2.0000
   53.6280    0.4829    2.0000
   56.6750    0.4029    2.0000
   43.4230    0.6805    2.0000
   20.3390    0.4276    2.0000
   42.6930    0.6826    2.0000
   13.6030    0.2060    2.0000
   30.3360    0.6497    2.0000
   43.3470    0.6749    2.0000
   56.6860    0.3977    2.0000
   50.5480    0.5591    2.0000
   34.2270    0.6929    2.0000
   47.8370    0.6136    2.0000
   30.8520    0.6593    2.0000
   51.3290    0.5050    3.0000
   29.5010    0.7789    3.0000
   34.8950    0.8050    3.0000
   44.7400    0.6884    3.0000
   51.7180    0.4927    3.0000
   40.4810    0.7621    3.0000
   38.7370    0.7834    3.0000
   26.3020    0.7379    3.0000
   32.8210    0.8072    3.0000
   45.6900    0.6684    3.0000
   54.2200    0.4058    3.0000
   46.0430    0.6611    3.0000
   10.9310    0.2747    3.0000
   43.7390    0.7043    3.0000
   31.9250    0.7948    3.0000
   31.8910    0.7954    3.0000
   15.8520    0.4592    3.0000
   50.7340    0.5237    3.0000
   26.2430    0.7305    3.0000
   22.3110    0.6536    3.0000
   14.7690    0.1796    4.0000
   17.3260    0.2304    4.0000
   41.5570    0.3898    4.0000
   52.9660    0.2604    4.0000
   58.7110    0.1558    4.0000
And my code is as follows, with data being the matrix (double)
  function dataPlot(data)

    %1xN matrix with bacteria
    A=data(:,3);

    %Number of different bacterias is counted, and gathered in a vector
    barData = [sum(A(:) == 1), sum(A(:) == 2), sum(A(:) == 3), sum(A(:) == 4)];

    figure
    bar(barData);
    label = {'Salmonella enterica'; 'Bacillus cereus'; 'Listeria'; 'Brochothrix thermosphacta'};
    set(gca,'xtick',[1:4],'xticklabel',label)
    set(gca,'XTickLabelRotation',45)
    ylabel('Observations')
    title('Destribution of bacteria')

    %The data is divided into four matrices based on the four different bacterias
    %Salmonella matrix
    S=data;
    deleterow = false(size(S, 1), 1);
    for n = 1:size(S, 1)
    %For column condition
    if S(n, 3)~= 1
        %Mark line for deletion afterwards
        deleterow(n) = true;
    end
    end
    S(deleterow,:) = [];
    S=S(:,1:2);
    S=sortrows(S,1);

    %Bacillus cereus
    Ba=data;
    deleterow = false(size(Ba, 1), 1);
    for p = 1:size(Ba, 1)
    %For column condition
    if Ba(p, 3)~= 2
        %Mark line for deletion afterwards
        deleterow(p) = true;
    end
    end
    Ba(deleterow,:) = [];
    Ba=Ba(:,1:2);
    Ba=sortrows(Ba,1);

    %Listeria
    L=data;
    deleterow = false(size(L, 1), 1);
    for v = 1:size(L, 1)
    %For column condition
    if L(v, 3)~= 3
        %Mark line for deletion afterwards
        deleterow(v) = true;
    end
    end
    L(deleterow,:) = [];
    L=L(:,1:2);
    L=sortrows(L,1);

    %Brochothrix thermosphacta
    Br=data;
    deleterow = false(size(Br, 1), 1);
    for q = 1:size(Br, 1)
    %For column condition
    if Br(q, 3)~= 3
        %Mark line for deletion afterwards
        deleterow(q) = true;
    end
    end
    Br(deleterow,:) = [];
    Br=Br(:,1:2);
    Br=sortrows(Br,1);

    %The data is plotted (growth rate against temperature)
    figure
    plot(S(:,1), S(:, 2), Ba(:,1), Ba(:, 2), L(:,1), L(:, 2), Br(:,1), Br(:, 2))
    xlim([10 60])
    ylim([0; Inf])
    xlabel('Temperature')
    ylabel('Growth rate')
    title('Growth rate as a function of temperature')
    legend('Salmonella enterica','Bacillus cereus','Listeria','Brochothrix thermosphacta')
Can anyone help me fix it so when I have a matrix without eg 2 in the third column, it will still plot correctly?
I do know how to filter it correctly, and apply that filtering to 'data', so the only problem is the error codes occurring when plotting.
The errors are;
Warning: Ignoring extra legend entries.
> In legend>set_children_and_strings (line 643)
  In legend>make_legend (line 328)
  In legend (line 254)
  In dataPlot (line 82)
  In Hovedscript (line 153)
When running this function from a main script with the matrix sorted by growth rate (second column) and filtering for only third row values 1, 3 and 4 to be analyzed. The filtering is done through another function, done in advance, and the new 'data' looks like this.
   59.2390    0.0584    1.0000
   58.7110    0.1558    4.0000
   14.7690    0.1796    4.0000
   56.1370    0.2052    1.0000
   17.3260    0.2304    4.0000
   52.9660    0.2604    4.0000
   10.9310    0.2747    3.0000
   41.5570    0.3898    4.0000
   51.9480    0.3932    1.0000
   54.2200    0.4058    3.0000
   15.8520    0.4592    3.0000
   50.0190    0.4754    1.0000
   51.7180    0.4927    3.0000
   51.3290    0.5050    3.0000
   50.7340    0.5237    3.0000
   13.5340    0.5742    1.0000
   45.7840    0.6254    1.0000
   22.3110    0.6536    3.0000
   46.0430    0.6611    3.0000
   45.6900    0.6684    3.0000
   44.7400    0.6884    3.0000
   43.7390    0.7043    3.0000
   26.2430    0.7305    3.0000
   42.3400    0.7371    1.0000
   26.3020    0.7379    3.0000
   40.4810    0.7621    3.0000
   29.5010    0.7789    3.0000
   38.7370    0.7834    3.0000
   31.9250    0.7948    3.0000
   31.8910    0.7954    3.0000
   34.8950    0.8050    3.0000
   32.8210    0.8072    3.0000
   39.1220    0.8102    1.0000
   37.1830    0.8513    1.0000
   24.2970    0.8615    1.0000
   25.3870    0.8774    1.0000
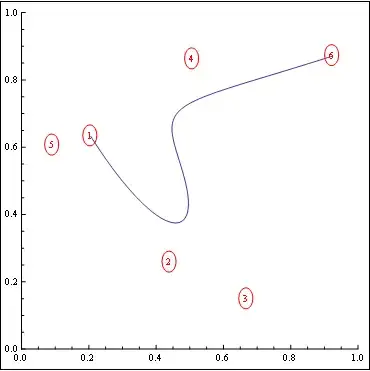
Again, the bar plot works just fine, but does show all 4 bacteria even when only 3 of them are used, and the problem is in the line plot, with one line not showing in the plot.
Thank you for your time

