I am trying to produce a series of box plots in R that is grouped by 2 factors. I've managed to make the plot, but I cannot get the boxes to order in the correct direction.
My data farm I am using looks like this:
Nitrogen    Species    Treatment
2           G          L
3           R          M
4           G          H
4           B          L
2           B          M
1           G          H
I tried:
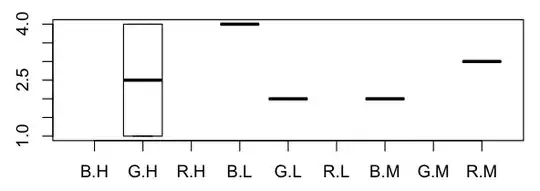
boxplot(mydata$Nitrogen~mydata$Species*mydata$Treatment)
this ordered the boxes alphabetically (first three were the "High" treatments, then within those three they were ordered by species name alphabetically).
I want the box plot ordered Low>Medium>High then within each of those groups G>R>B for the species.
So i tried using a factor in the formula:
f = ordered(interaction(mydata$Treatment, mydata$Species),
            levels = c("L.G","L.R","L.B","M.G","M.R","M.B","H.G","H.R","H.B")
then:
boxplot(mydata$Nitrogen~f)
however the boxes are still shoeing up in the same order. The labels are now different, but the boxes have not moved.
I have pulled out each set of data and plotted them all together individually:
lg = mydata[mydata$Treatment="L" & mydata$Species="G", "Nitrogen"]
mg = mydata[mydata$Treatment="M" & mydata$Species="G", "Nitrogen"]
hg = mydata[mydata$Treatment="H" & mydata$Species="G", "Nitrogen"]
etc ..

boxplot(lg, lr, lb, mg, mr, mb, hg, hr, hb)
This gives what i want, but I would prefer to do this in a more elegant way, so I don't have to pull each one out individually for larger data sets.
Loadable data:
mydata <-
structure(list(Nitrogen = c(2L, 3L, 4L, 4L, 2L, 1L), Species = structure(c(2L,
3L, 2L, 1L, 1L, 2L), .Label = c("B", "G", "R"), class = "factor"),
    Treatment = structure(c(2L, 3L, 1L, 2L, 3L, 1L), .Label = c("H",
    "L", "M"), class = "factor")), .Names = c("Nitrogen", "Species",
"Treatment"), class = "data.frame", row.names = c(NA, -6L))

and
– Alex Brown Nov 23 '10 at 22:16