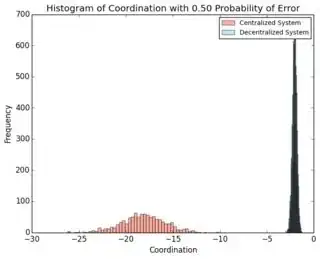
I am plotting a histogram using Matplotlib. I would like the color of the histogram to be "sky blue". But the data overlaps, and produces a histogram which is nearly black in color.
plt.hist(data, color = "skyblue")
Below is how the histogram looks. As you can see, even though I specified the color to be "Skyblue, the histogram on the right is nearly black.

