2

I have a dendrogram:

set.seed(10)
mat <- matrix(rnorm(20*10),nrow=20,ncol=10)
dend <- as.dendrogram(hclust(dist(mat)))

And given a depth cutoff:

I'd like to cut all branches that are to the right to that cutoff.

depth.cutoff <- 4.75

I'd like to cut all branches to the right of the dashed line:

plot(dend,horiz = TRUE)
abline(v=depth.cutoff,col="red",lty=2)

enter image description here

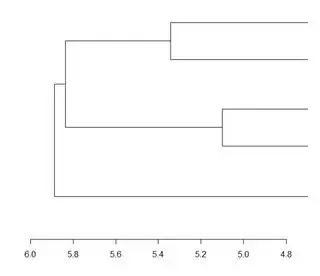
And to end up with this dendrogram:

enter image description here

The closest I got was using ape's drop.tip, but the problem with that is if my depth.cutoff includes all leaves, as in this example, it returns NULL.

Perhaps anyone knows if and how I can delete elements from the nested list which represents my dendrogram if their depth is below depth.cutoff?

Alternatively, perhaps I can convert the dendrogram to a data.frame, which also lists the depth of each node (including leaves which will have depth=0), remove all rows with depth < depth.cutoff from that data.frame, and then convert that back to a dendrogram?

dan
  • 6,048
  • 10
  • 57
  • 125

2 Answers2

2

cut will cut the tree at a specified height. It will return a list of the upper and lower portions

cut(dend, h = depth.cutoff)$upper

# $upper
# 'dendrogram' with 2 branches and 5 members total, at height 5.887262 
# 
# $lower
# $lower[[1]]
# 'dendrogram' with 2 branches and 6 members total, at height 4.515119 
# 
# $lower[[2]]
# 'dendrogram' with 2 branches and 2 members total, at height 3.789259 
# 
# $lower[[3]]
# 'dendrogram' with 2 branches and 5 members total, at height 3.837733 
# 
# $lower[[4]]
# 'dendrogram' with 2 branches and 3 members total, at height 3.845031 
# 
# $lower[[5]]
# 'dendrogram' with 2 branches and 4 members total, at height 4.298743


plot(cut(dend, h = depth.cutoff)$upper, horiz = T)

enter image description here

SymbolixAU
  • 25,502
  • 4
  • 67
  • 139
  • Thanks a lot @SymbolixAU. Do you know if there's a way to get all branches to end at the same line? Not in the plot but rather in the dend object? – dan Feb 02 '17 at 01:30
2

A perhaps more direct way of getting your picture is just to set the limits that you want to plot.

plot(dend, horiz = TRUE, xlim=c(6,4.75))

Cropped Dendrogram

G5W
  • 36,531
  • 10
  • 47
  • 80