6

How can I get the area under overlapping density curves?

How can I solve the problem with R? (There is a solution for python here: Calculate overlap area of two functions )

set.seed(1234)
df <- data.frame(
  sex=factor(rep(c("F", "M"), each=200)),
  weight=round(c(rnorm(200, mean=55, sd=5),
                 rnorm(200, mean=65, sd=5)))
  )

(Source: http://www.sthda.com/english/wiki/ggplot2-density-plot-quick-start-guide-r-software-and-data-visualization )

ggplot(df, aes(x=weight, color=sex, fill=sex)) + 
 geom_density(aes(y=..density..), alpha=0.5)

"The points used in the plot are returned by ggplot_build(), so you can access them." So now, I have the points, and I can feed them to approxfun, but my problem is that i don't know how to subtract the density functions.

Any help greatly appreciated! (And I believe in high demand, there is no solution for this readily available.)

Community
  • 1
  • 1
user5878028
  • 117
  • 1
  • 13
  • produces an error: `grt <- ggplot(df, aes(x=weight, color=sex, fill=sex)) + geom_density(aes(y=..density..), alpha=0.5) dpb <- ggplot_build(grt) x1 <- min(which(dpb$data[[1]]$x >=50)) x2 <- max(which(dpb$data[[1]]$x <=70)) grt + geom_area(data=data.frame(x=dpb$data[[1]]$x[x1:x2], y=dpb$data[[1]]$y[x1:x2]),aes(x=x, y=y), fill="grey")` – user5878028 Jan 28 '17 at 20:34
  • maybe this http://stats.stackexchange.com/questions/97596/how-to-calculate-overlap-between-empirical-probability-densities could help – MLavoie Jan 28 '17 at 20:44
  • Thanks, looks good. However, because of the rescaling, can I still get the probability of the intersect? Will try now. – user5878028 Jan 28 '17 at 20:55

3 Answers3

5

I was looking for a way to do this for empirical data, and had the problem of multiple intersections as mentioned by user5878028. After some digging I found a very simple solution, even for a total R noob like me:

Install and load the libraries "overlapping" (which performs the calculation) and "lattice" (which displays the result):

library(overlapping)
library(lattice)

Then define a variable "x" as a list that contains the two density distributions you want to compare. For this example, the two datasets "data1" and "data2" are both columns in a text file called "yourfile":

x <- list(X1=yourfile$data1, X2=yourfile$data2)

Then just tell it to display the output as a plot which will also display the estimated % overlap:

out <- overlap(x, plot=TRUE)

I hope this helps someone like it helped me! Here's an example overlap plot

overlapping plot

clemens
  • 16,716
  • 11
  • 50
  • 65
Karop
  • 66
  • 1
  • 2
2

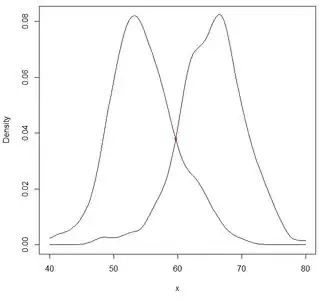
I will make a few base R plots, but the plots are not actually part of the solution. They are just there to confirm that I am getting the right answer.

You can get each of the density functions and solve for where they intersect.

##  Create the two density functions and display
FDensity = approxfun(density(df$weight[df$sex=="F"], from=40, to=80))
MDensity = approxfun(density(df$weight[df$sex=="M"], from=40, to=80))
plot(FDensity, xlim=c(40,80), ylab="Density")
curve(MDensity, add=TRUE)

Now solve for the intersection

## Solve for the intersection and plot to confirm
FminusM = function(x) { FDensity(x) - MDensity(x) }
Intersect = uniroot(FminusM, c(40, 80))$root
points(Intersect, FDensity(Intersect), pch=20, col="red")

Intersection of density plots

Now we can just integrate to get the area of the overlap.

integrate(MDensity, 40,Intersect)$value + 
    integrate(FDensity, Intersect, 80)$value
[1] 0.2952838
G5W
  • 36,531
  • 10
  • 47
  • 80
  • This only works for one intersection, correct? So 0.29 means that 30% of men and woman have the same weight, correct? – user5878028 Jan 28 '17 at 23:55
  • Just found out that my density plot using my real data is oscillating, although I can't see it because the ratio is 1:10000 between what I can see and the oscillation. However, if both density distributions seem to be a flatline at y=0.00...1, in fact there are a million overlaps of microscopic scale. Damn. Trying a workaorund by limiting the Intersect to density > mean(density)*0.01 – user5878028 Jan 29 '17 at 00:21
  • @user5878028 No, It does not mean that 30% have the same weight. It means that 30% have a weight that is more typical of the opposite sex. I.e. 12% of men have a weight that is more typical of women and 17 of women have a weight typical of men. WRT multiple intersections, you are right. this solution assumed a single intersection. – G5W Jan 29 '17 at 13:05
  • Could you say that in 30% of the population it is not possible to determine if the person is a female or male if you only know the weight? – user5878028 Jan 29 '17 at 13:58
  • Well, for 100% of the population you cannot _determine_ the gender from weight. What this says is that if you predict gender based on the most likely gender for the given weight, you will make a mistake 30% of the time. – G5W Jan 29 '17 at 14:03
-1

The above two proposed methods give different results. If the data in the first answer is given to the overlap function it will result in overlap% of 0.18, while the first one results in overlap% of 0.29.

X1 = df$weight[df$sex=="F"]
X2 = df$weight[df$sex=="M"]
x=list(X1=X1, X2=X2)

out <- overlap(x, plot=TRUE)
out$OV
 X1-X2 
 0.1754
vahed
  • 11
  • 2
  • This does not provide an answer to the question. Once you have sufficient [reputation](https://stackoverflow.com/help/whats-reputation) you will be able to [comment on any post](https://stackoverflow.com/help/privileges/comment); instead, [provide answers that don't require clarification from the asker](https://meta.stackexchange.com/questions/214173/why-do-i-need-50-reputation-to-comment-what-can-i-do-instead). - [From Review](/review/late-answers/31097956) – zephryl Feb 22 '22 at 11:49