Let's say I have a dataframe with 100 rows and 40 columns where column 40 represents the Y axis values for the scatter plots. For 39 scatter plots, I would like to plot column 40 in function of column 1, column 40 in function of column 2, column 40 in function of column 3, etcetera up to column 40 in function of column 39. What would be the best way to produce such a subplot without having to do it all manually?
For example (with a smaller dataframe), trying to scatter plot column 3 in function of column 1 and column 3 in function of column 2 in a subplot.
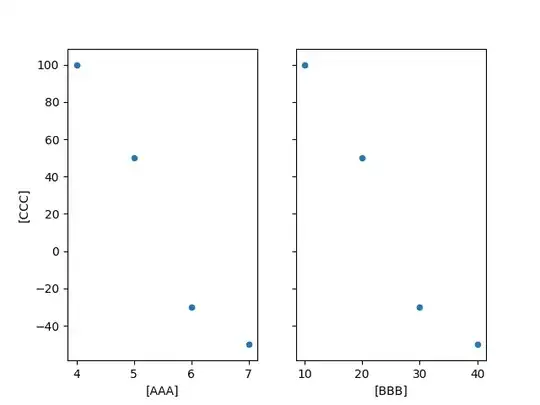
df = pd.DataFrame({'AAA' : [4,5,6,7], 'BBB' : [10,20,30,40],'CCC' : [100,50,-30,-50]})
df.plot(x=["AAA", "BBB"], y=["CCC"], kind="scatter", subplots=True, sharey=True)