I am having some trouble keeping the size even across all elements in my gridLayout.
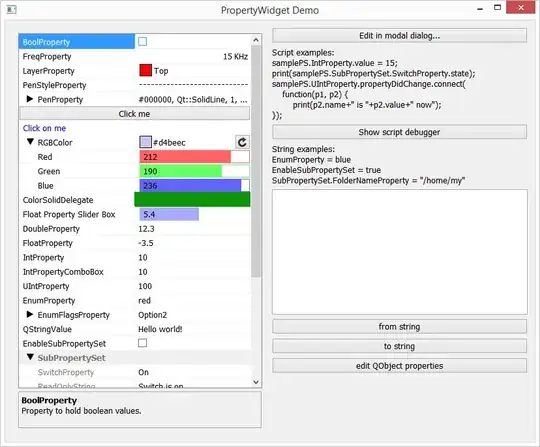
Ocasionally the inner widgets just completely change size after I update the plot data (on both width and height), and especially after maximizing/minimizing or changing the window size:
What I was hoping to achieve was for the size to be kept evenly distributed regardless of the dimensions of the window:
This is a summary of what I have written to populate the grid, and how I update the CSS to make the borders change color. I notice that if I do not change the CSS then this issue is not apparent.
class ResultsViewer(QtGui.QWidget):
    plots = {} #the currently displayed plot widgets
    curves = {} #the currently displayed data that store the points

    def __init__(self):
        super(ResultsViewer, self).__init__()
        self.win = QtGui.QMainWindow()
        self.win.setCentralWidget(self)
        self.win.resize(800, 250)
        self.win.setWindowTitle("Cavity Results Viewer")
        self.grid = QtGui.QGridLayout(self)
        self.win.setWindowFlags(self.win.windowFlags() | QtCore.Qt.WindowStaysOnTopHint)

    def reset_indicators(self):
        for plot in self.plots.keys():
            self.plots[plot].setStyleSheet("""
                                border-top: 5px solid rgba(0,0,0,0);
                                border-radius: 12px;
                                """)

    def set_indicator_border_color(self, cavnum, result):
        color = "lime" if result['decision'] else "red"
        self.plots[cavnum].setStyleSheet("""
                        border-top: 5px solid %s;
                        border-radius: 12px;
                        """ % color)

    def create_indicators(self, params):
        for c, cavnum in enumerate(params.keys()):
            r = (4 % (c + 1)) / 4 #every fourth column jump to next row

            box = QtGui.QHBoxLayout()

            plt = pg.PlotWidget()

            plt.setStyleSheet("""
                        border-top: 5px solid yellow;
                        border-radius: 12px;
                    """)
            curve_blue = plt.plotItem.plot(pen=None, symbol='o', symbolPen=None, symbolSize=8, symbolBrush=(100, 100, 255, 80)) #points for showing history data
            curve_green = plt.plotItem.plot(pen=None, symbol='o', symbolPen=None, symbolSize=8,symbolBrush=(100, 255, 100, 80))
            curve_blue_last = plt.plotItem.plot(pen=None, symbol='x', symbolPen=None, symbolSize=18, symbolBrush=(50, 50, 255, 255)) #points for showing the newest data
            curve_green_last = plt.plotItem.plot(pen=None, symbol='x', symbolPen=None, symbolSize=18,symbolBrush=(50, 255, 50, 255))

            plt.plotItem.setLabel('left', "Amplitude", units='A')
            plt.plotItem.setLabel('bottom', "Frequency", units='Hz')
            self.plots[cavnum] = plt
            self.curves[cavnum] = {"blue": curve_blue,
                                   "blue_last": curve_blue_last,
                                   "green": curve_green,
                                   "green_last": curve_green_last}
            box.addWidget(plt)
            self.grid.addLayout(box, r, c % 4)

    def update(self, cavnum, results):
        #update the plots and render all points
        ...
        ...
        self.set_indicator_border_color(cavnum, result)
[UPDATE]
And this is a fully functional example:
import sys, time
import random
import numpy as np
import pyqtgraph as pg
from PyQt4 import QtCore, QtGui

class ResultsViewer(QtGui.QWidget):
    plots = {} #the currently displayed plot widgets
    curves = {} #the currently displayed data that store the points

    def __init__(self):
        super(ResultsViewer, self).__init__()
        self.win = QtGui.QMainWindow()
        self.win.setCentralWidget(self)
        self.win.resize(800, 250)
        self.win.setWindowTitle("Cavity Results Viewer")
        self.grid = QtGui.QGridLayout(self)
        self.win.setWindowFlags(self.win.windowFlags() | QtCore.Qt.WindowStaysOnTopHint)

        self.win.show()

    def reset_indicators(self):
        #return #Uncomment this to skip modifying the CSS (resizing problem seems to go away!!!)
        for plot in self.plots.keys():
            self.plots[plot].setStyleSheet("""
                                border-top: 5px solid rgba(0,0,0,0);
                                border-radius: 12px;
                                """)

    def set_indicator_border_color(self, cavnum, result):
        #return #Uncomment this to skip modifying the CSS (resizing problem seems to go away!!!)
        color = "lime" if result['decision'] else "red"
        self.plots[cavnum].setStyleSheet("""
                        border-top: 5px solid %s;
                        border-radius: 12px;
                        """ % color)

    def create_indicators(self, params):
        for c, cavnum in enumerate(params.keys()):
            r = (4 % (c + 1)) / 4 #every fourth column jump to next row

            box = QtGui.QHBoxLayout()

            plt = pg.PlotWidget()

            plt.setStyleSheet("""
                        border-top: 5px solid yellow;
                        border-radius: 12px;
                    """)
            curve_blue = plt.plotItem.plot(pen=None, symbol='o', symbolPen=None, symbolSize=8, symbolBrush=(100, 100, 255, 80)) #points for showing history data
            curve_green = plt.plotItem.plot(pen=None, symbol='o', symbolPen=None, symbolSize=8,symbolBrush=(100, 255, 100, 80))


            plt.plotItem.setLabel('left', "Amplitude", units='A')
            plt.plotItem.setLabel('bottom', "Frequency", units='Hz')
            self.plots[cavnum] = plt
            self.curves[cavnum] = {"blue": curve_blue,
                                   "green": curve_green}
            box.addWidget(plt)
            self.grid.addLayout(box, r, c % 4)

    def update(self, cavnum, results):
        #update the plots and render all points
        max_history = 1000 #max points per plot to store

        result = results[cavnum]
        if result.has_key('peaks'):
            peaks = result['peaks']

            if peaks.has_key('amps'):
                amps = np.round(peaks['amps'], 2)
                freqs = np.round(peaks['freqs'], 2)

                x_blue, y_blue = self.curves[cavnum]['blue'].getData()
                x_blue = np.append(freqs, x_blue)[:max_history]
                y_blue = np.append(amps, y_blue)[:max_history]

                x_blue = x_blue[x_blue != np.array(None)] #remove any none from the initial getData
                y_blue = y_blue[y_blue != np.array(None)] #remove any none from the initial getData
                self.curves[cavnum]['blue'].setData(x_blue, y_blue)

        self.set_indicator_border_color(cavnum, result)

class MyThread(QtCore.QThread):
    update = QtCore.pyqtSignal(int, object)

    def __init__(self, resutls, parent=None):
        super(MyThread, self).__init__(parent)
        self.results = resutls #number of plots

    def run(self):
        while True:
            for cavnum in range(len(self.results.keys())):
                time.sleep(1)
                peaks = {'amps': np.random.rand(3,1), 'freqs': np.random.rand(3,1)}
                self.results[cavnum]['decision'] = bool(random.getrandbits(1))
                self.results[cavnum]['peaks'] = peaks
                self.update.emit(cavnum, self.results)


# create the dialog for zoom to point
class MainApp(QtGui.QMainWindow):
    def __init__(self, parent=None):
        super(MainApp, self).__init__(parent)
        # Set up the user interface from Designer.

        n = 8
        results = {}
        for x in range(n):
            results[x] = {}

        self.thread = MyThread(results)
        self.thread.update.connect(self.update)

        self.viewer = ResultsViewer()
        self.viewer.create_indicators(results)

        self.thread.start()

    def update(self, cavnum, data):
        self.viewer.update(cavnum, data)

if __name__ == "__main__":
    app = QtGui.QApplication([])
    widget = MainApp()
    widget.move(300, 300)
    widget.show()
sys.exit(app.exec_())


