I wrote a small script to do just this. Feel free to make suggestions and edits. It works by checking if the surface of each sphere falls within the volume of all of the other spheres.
For sphere intersection, it's better (but slower) to use a larger number of faces in the sphere() function call. This should give denser results in the visualization. For the sphere-alone visualization, a smaller number (~50) should suffice. See the comments for how to visualize each.
close all
clear
clc

% centers   : 3 x N matrix of [X;Y;Z] coordinates
% dist      : 1 x N vector of sphere radii

%% Plot spheres (fewer faces)
figure, hold on % One figure to rule them all
[x,y,z] = sphere(50); % 50x50-face sphere
for i = 1 : size(centers,2)
    h = surfl(dist(i) * x + centers(1,i), dist(i) * y + centers(2,i), dist(i) * z + centers(3,i));
    set(h, 'FaceAlpha', 0.15)
    shading interp
end

%% Plot intersection (more faces)
% Create a 1000x1000-face sphere (bigger number = better visualization)
[x,y,z] = sphere(1000);

% Allocate space
xt = zeros([size(x), size(centers,2)]);
yt = zeros([size(y), size(centers,2)]);
zt = zeros([size(z), size(centers,2)]);
xm = zeros([size(x), size(centers,2), size(centers,2)]);
ym = zeros([size(y), size(centers,2), size(centers,2)]);
zm = zeros([size(z), size(centers,2), size(centers,2)]);

% Calculate each sphere
for i = 1 : size(centers, 2)
    xt(:,:,i) = dist(i) * x + centers(1,i);
    yt(:,:,i) = dist(i) * y + centers(2,i);
    zt(:,:,i) = dist(i) * z + centers(3,i);
end

% Determine whether the points of each sphere fall within another sphere
% Returns booleans
for i = 1 : size(centers, 2)
    [xm(:,:,:,i), ym(:,:,:,i), zm(:,:,:,i)] = insphere(xt, yt, zt, centers(1,i), centers(2,i), centers(3,i), dist(i)+0.001);
end

% Exclude values of x,y,z that don't fall in every sphere
xmsum = sum(xm,4);
ymsum = sum(ym,4);
zmsum = sum(zm,4);
xt(xmsum < size(centers,2)) = 0;
yt(ymsum < size(centers,2)) = 0;
zt(zmsum < size(centers,2)) = 0;

% Plot intersection
for i = 1 : size(centers,2)
    xp = xt(:,:,i);
    yp = yt(:,:,i);
    zp = zt(:,:,i);
    zp(~(xp & yp & zp)) = NaN;
    surf(xt(:,:,i), yt(:,:,i), zp, 'EdgeColor', 'none');
end
and here is the insphere function
function [x_new,y_new,z_new] = insphere(x,y,z, x0, y0, z0, r)
    x_new = (x - x0).^2 + (y - y0).^2 + (z - z0).^2 <= r^2;
    y_new = (x - x0).^2 + (y - y0).^2 + (z - z0).^2 <= r^2;
    z_new = (x - x0).^2 + (y - y0).^2 + (z - z0).^2 <= r^2;
end
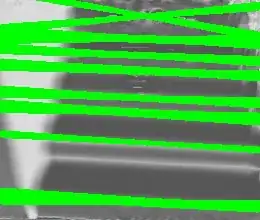
Sample visualizations
For the 6 spheres used in these examples, it took an average of 1.934 seconds to run the combined visualization on my laptop.
Intersection of 6 spheres:
Actual 6 spheres:
Below, I've combined the two so you can see the intersection in the view of the spheres.
For these examples:
centers =

   -0.0065   -0.3383   -0.1738   -0.2513   -0.2268   -0.3115
    1.6521   -5.7721   -1.7783   -3.5578   -2.9894   -5.1412
    1.2947   -0.2749    0.6781    0.2438    0.4235   -0.1483

dist =

    5.8871    2.5280    2.7109    1.6833    1.9164    2.1231
I hope this helps anyone else who may desire to visualize this effect.


