using Gadfly, DataFrames

v = DataFrame(x = [1,2,3], y = [0.5,-0.7,1.2], label = ["a","b","c"])

plot(v , x=:x, y=:y, Geom.bar, Theme(bar_spacing = 2mm),
Guide.title("geneX"), Guide.ylabel("fold change"),
Guide.xlabel("technique"), color = :label)
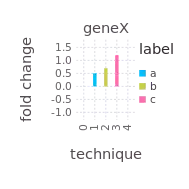
produces the following plot:

(the snd bar should be negativ)
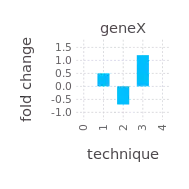
#  without 'color = :label'
plot(v , x=:x, y=:y, Geom.bar, Theme(bar_spacing = 2mm),
Guide.title("geneX"), Guide.ylabel("fold change"), Guide.xlabel("technique"))

Is there a workaround for this issue available?
Best regards,
Sebastian