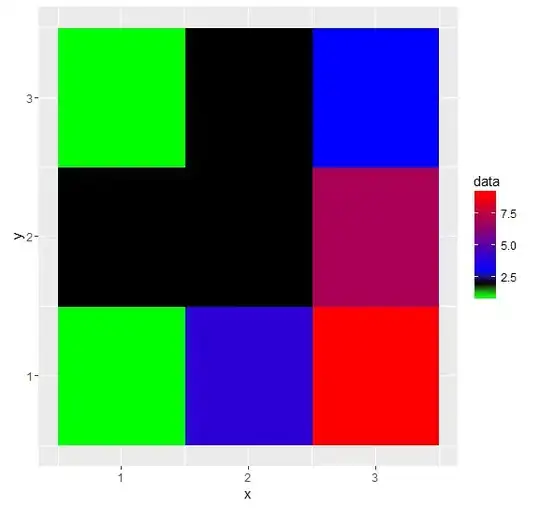
I am trying to plot two data.frame as two layers using ggplot2 "geom_raster" function. The top layer contains NA values that are set to "transparent" in order to make the underneath layer visible. As the scale_fill_xxx function can't be used twice, I've tried the following code (based on this post : ggplot2 - using two different color scales for overlayed plots) :
library(ggplot2)

df1 <- data.frame(x=rep(c(1,2,3),times=3), y=c(1,1,1,2,2,2,3,3,3), data= c(NA,4,9,NA,2,7,NA,NA,3))
df2 <- data.frame(x=rep(c(1,2,3),times=3), y=c(1,1,1,2,2,2,3,3,3), data= c(1,NA,NA,2,NA,NA,1,2,NA))

ggplot() +
geom_raster(data=df1, aes(y= y, x= x, fill= data)) +
scale_fill_gradientn(name="df1", colours=c("red", "blue"), na.value = "transparent") +
geom_raster(data= df2, aes(y= y, x= x, colour= as.factor(data))) +
scale_colour_manual(values = c("green", "black"), name= "df2", labels= c("Class 1", "Class 2"), na.value="transparent")
The thing is that the "colour" / "scale_colour_manual" solution does not return what I expect (it returns a dark grey plot instead). I would like the df1 "data" column to be represented on a red to blue scale (NA's should be transparent) and the df2 "data" column to be represented according to class number ("1"=green and "2"=black).
Could anyone help me to understand what's wrong with my procedure?

