I have a SpatialPolygonsDataFrame with columns containing hex-color values. I want to draw the map like this with the package tmap:
tm_shape(full.shp) + tm_fill(col="konf1900")
But then it is treated as categorial variable, resulting in this:
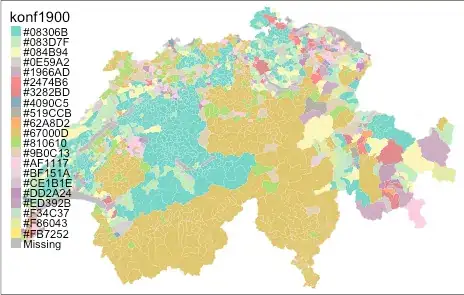
I am not sure how to tell tmap that it should plot the color values directly on the map...
Can anyone help on this?
edit:
see the answers below - the problem was that the dataframe column was no encoded as.character. I think this might help someone sometime...

