The Float32Array obtained using getFloatTimeDomainData will contain an array of sample values, each value defining the amplitude at the sampled location, usually in the domain of [-1, 1]. Sample locations are uniquely distributed, the obtained data is essentially the equivalent of raw PCM.
For a sine wave, it would yield gradually changing continuous values among the following approximation curve:
0 ... 0.7 ... 1.0 ... 0.7 ... 0 ... -0.7 ... -1.0 ... -0.7 ... 0 ...
Think of it as a series of subsequent values that together define the shape of the audio wave; if you were to visualize the obtained values on, say, a canvas, using the sample values as y coordinates (amplitude) and a subsequently increasing value for x coordinates (time), you would get an oscilloscope, such as:
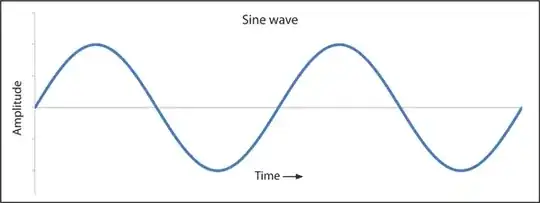
Note how this sine waveform correlates with the example values above. Here are some example operations you can do on this data to get a better understanding:
If you were to multiply each value by 2, you would amplify the volume by 100% (double volume)
If you were to replace every value with 0, you would get silence
If you were to skip every second value, you would get a 100% pitched up audio (double playback speed)