0

I have a feature vector of 180 elements, and have applied a PCA on it. The problem is that the first pc has a high variance, but according to this biplot diagram for pc1 vs pc2, it seems that this is happening because of an outlier. Which is strange to me. pc1 vs pc2

Apparently the first PC is not the best indicator for classification here.

Here is also the biplot diagram for pc2 vs pc3: pc2 vs pc3
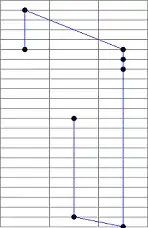
I am using R for this. Any suggestion why is this happening and how I can solve this? Should I remove the outliers? If yes what is the best way to do so by R.

--Edit

I am using prcomp(features.df, center= TRUE, scale = TRUE) to normalize the data.

Hamed
  • 474
  • 5
  • 17
  • 1
    PCA is very sensitive to outliers. Have you scaled your data at all? I would look into the outlier and see what is going on there -- it could be indicative of an issue with your data (or you may learn something new from it). You might also try redoing the PCA without the outlier and seeing how that looks. – Keith Hughitt Oct 18 '16 at 18:26
  • If by scaling you mean to bring all the feature elements in the interval [0, 1], yes I have done that. Indeed in this case it becomes even more severe. – Hamed Oct 18 '16 at 18:32
  • Seems like you have statistical issues, not programming issues. I'd suggest moving to stats.stackexchange. – Gregor Thomas Oct 18 '16 at 18:35
  • Also, if you scale your data so as to have equal variance instead of equal range, the influence of the outlier won't be quite as extreme. – Gregor Thomas Oct 18 '16 at 18:35
  • thanks for the heads up. I will move the question there. – Hamed Oct 18 '16 at 18:41
  • But about your suggestion, my assumption is that calling prcomp like the following does the normaliztion: `prcomp(features.df, center= TRUE, scale = TRUE) ` correct me if I am wrong. – Hamed Oct 18 '16 at 18:50

1 Answers1

0

Even without the outlier, PCA may be entirely nonsensical if your goal is classification aka "discrimination" ((the term being completely "politized" is rare nowaday in the statistical context)). That's why "they" invented "crimcoords" as different but related to the "prin.coords" where the latter are stats slang for 'principal coordinates' (related to your principal components). "Crimcoords" seem no longer easy to find on the web; in the last century every good statistician knew +- what they were. A good reference seems Gnanadesikan's monography "Methods for Statistical Data Analysis of Multivariate Observations" (1st edition 1977, 2nd ed 1997; Wiley).

And Ram Gnanadesikan was already very much aware of the problem of outliers and so mentioned "robust" methods.

Nowadays, the "standard" R package for robust multivariate statistics is 'rrcov' (by Valentin Todorov)... a modern version of the topic (I think allowing "lasso" type regularization) is package 'rrlda' with main function rrlda() indeed allowing both robust and Lasso (L1) penalization.

Martin Mächler
  • 4,619
  • 27
  • 27