3

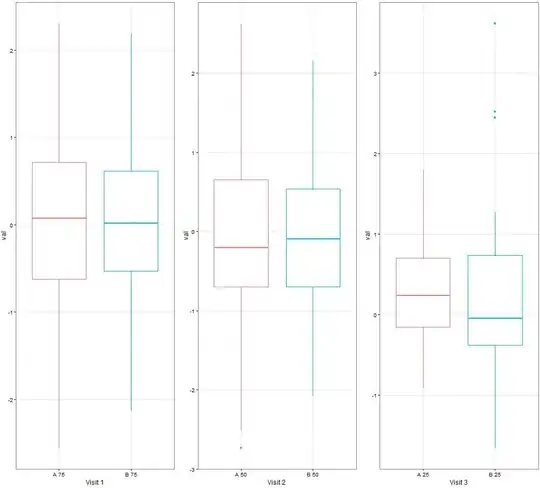
I'm trying to produce a boxplot of some numeric outcome broken down by treatment condition and visit number, with the number of observations in each box placed under the plot, and the visit numbers labeled as well. Here's some fake data that will serve to illustrate, and I give two examples of things I've tried that didn't quite work.

library(ggplot2)
library(plyr)

trt      <- factor(rep(LETTERS[1:2],150),ordered=TRUE)
vis      <- factor(c(rep(1,150),rep(2,100),rep(3,50)),ordered=TRUE)
val      <- rnorm(300)
data     <- data.frame(trt,vis,val)
data.sum <- ddply(data, .(vis, trt), summarise,
            N=length(na.omit(val)))
mytheme  <- theme_bw() + theme(panel.margin = unit(0, "lines"), strip.background = element_blank())

The below code produces a plot that has N labels where I want them. It does this by grabbing summary data from an auxiliary dataset I created. However, I couldn't figure out how to also label visit on the x-axis (ideally, below the individual box labels), or to delineate visits visually in other ways (e.g. lines separating them into panels).

plot1    <- ggplot(data) + 
            geom_boxplot(aes(x=vis:trt,y=val,group=vis:trt,colour=trt), show.legend=FALSE) +
            scale_x_discrete(labels=paste(data.sum$trt,data.sum$N,sep="\n")) +
            labs(x="Visit") + mytheme

The plot below is closer to what I want than the one above, in that it has a nice hierarchy of treatments and visits, and a pretty format delineating the visits. However, for each panel it grabs the Ns from the first row in the summary data that matches the treatment condition, because it doesn't "know" that each facet needs to use the row corresponding to that visit.

plot2    <- ggplot(data) +     geom_boxplot(aes(x=trt,y=val,group=trt,colour=trt), show.legend=FALSE) +
            facet_wrap(~ vis, drop=FALSE, switch="x", nrow=1) +
            scale_x_discrete(labels=paste(data.sum$trt,data.sum$N,sep="\n")) +
            labs(x="Visit") + mytheme
ErinMcJ
  • 593
  • 6
  • 20

2 Answers2

2

One workaround is to manipulate your dataset so your x variable is the interaction between trt and N.

Working off what you already have, you can add N to the original dataset via a merge.

test = merge(data, data.sum)

Then make a new variable that is the combination of trt and N.

test = transform(test, trt2 = paste(trt, N, sep = "\n"))

Now make the plot, using the new trt2 variable on the x axis and using scales = "free_x" in facet_wrap to allow for the different labels per facet.

ggplot(test) +     
    geom_boxplot(aes(x = trt2, y = val, group = trt, colour = trt), show.legend = FALSE) +
    facet_wrap(~ vis, drop = FALSE, switch="x", nrow = 1, scales = "free_x") +
    labs(x="Visit") + 
    mytheme 

enter image description here

aosmith
  • 34,856
  • 9
  • 84
  • 118
  • This got me most of the way there. Unfortunately, `scales="free_x"` seems to fight with `drop=FALSE`. In my larger context, I'm using grid.arrange to make an überplot that also includes a second plot for change from Visit 1, and I want to arrange Plot 2 so that (Vis2-Vis1) aligns visually with Vis2 in Plot 1. It works fine without my labels thanks to drop=FALSE, but when I add scales="free_x" it fails with the following error message: `"Error in if (zero_range(from) || zero_range(to)) { : missing value where TRUE/FALSE needed"` I haven't yet figured out if there's a workaround. – ErinMcJ Aug 18 '16 at 20:21
  • @ErinMcJ Do you have an example? You might ask a new question with an example of your real situation. It could be that annotating with the sample size inside the plot or avoiding faceting and using gridExtra-type solutions will end up working better for you. – aosmith Aug 18 '16 at 20:47
  • Thanks. Here's the more complex follow-up question. http://stackoverflow.com/questions/39027770/annotating-x-axis-with-n-in-faceted-plot-but-preserve-empty-facets – ErinMcJ Aug 18 '16 at 21:28
1

Since this functionality isn't built in a good work-around is grid.extra:

library(gridExtra)
p1    <- ggplot(data[data$vis==1,]) +     geom_boxplot(aes(x=trt,y=val,group=trt,colour=trt), show.legend=FALSE) +
  #facet_wrap(~ vis, drop=FALSE, switch="x", nrow=1) +
  scale_x_discrete(labels=lb[1:2]) + #paste(data.sum$trt,data.sum$N,sep="\n")
  labs(x="Visit") + mytheme

p2    <- ggplot(data[data$vis==2,]) +     geom_boxplot(aes(x=trt,y=val,group=trt,colour=trt), show.legend=FALSE) +
  #facet_wrap(~ vis, drop=FALSE, switch="x", nrow=1) +
  scale_x_discrete(labels=lb[3:4]) + #paste(data.sum$trt,data.sum$N,sep="\n")
  labs(x="Visit") + mytheme

p3    <- ggplot(data[data$vis==3,]) +     geom_boxplot(aes(x=trt,y=val,group=trt,colour=trt), show.legend=FALSE) +
  #facet_wrap(~ vis, drop=FALSE, switch="x", nrow=1) +
  scale_x_discrete(labels=lb[5:6]) + #paste(data.sum$trt,data.sum$N,sep="\n")
  labs(x="Visit") + mytheme


grid.arrange(p1,p2,p3,nrow=1,ncol=3) # fully customizable

enter image description here

Related: Varying axis labels formatter per facet in ggplot/R

You can also make them vertical or do other transformations:

enter image description here

Community
  • 1
  • 1
Hack-R
  • 22,422
  • 14
  • 75
  • 131