This feature is now in Mapbox GL js - https://docs.mapbox.com/mapbox-gl-js/example/cluster-html/
Key takeaways:
When setting your data source using map.addSource, make sure you define cluster: true and clusterRadius: int, like so:
map.addSource( 'sourceName', {
    type: "geojson",
    data: {
        type: 'FeatureCollection',
        features: [JSON]
    },
    cluster: true,
    clusterRadius: 80,
});
That will push mapbox to cluster your icons, but you need to tell mapbox what to do when it clusters those icons:
map.on( 'moveend', updateMarkers ); // moveend also considers zoomend
The business (trimmed down for relevance):
function updateMarkers(){
var features = map.querySourceFeatures( 'sourceName' );
for ( var i = 0; i < features.length; i++ ) {
var coords = features[ i ].geometry.coordinates;
var props = features[ i ].properties;
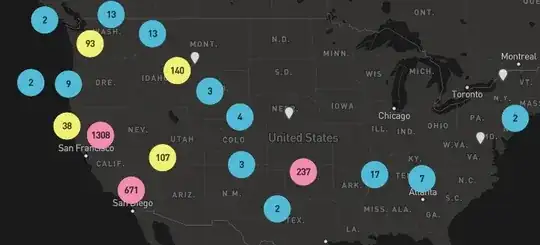
if ( props.cluster ){ // this property is only present when the feature is clustered
// generate your clustered icon using props.point_count
var el = document.createElement( 'div' );
el.classList.add( 'mapCluster' );
el.innerText = props.point_count;
marker = new mapboxgl.Marker( { element: el } ).setLngLat( coords );
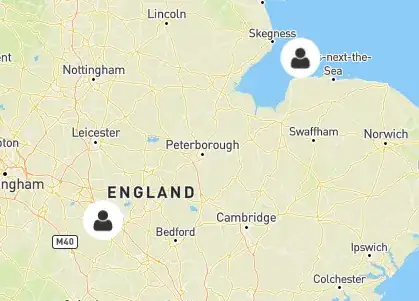
} else { // feature is not clustered, create an icon for it
var el = new Image();
el.src = 'icon.png';
el.classList.add( 'mapMarker' );
el.dataset.type = props.type; // you can use custom data if you have assigned it in the GeoJSON data
marker = new mapboxgl.Marker( { element: el } ).setLngLat( coords );
}
marker.addTo( map );
}
}
NOTE: Don't copy paste this code, rather use it in conjunction with https://docs.mapbox.com/mapbox-gl-js/example/cluster-html/ to get the whole picture. Hope this helps!