3

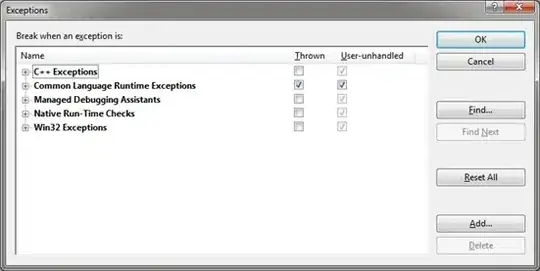
I have a problem in debugging customization code. please refer to this screenshot below :

enter image description here

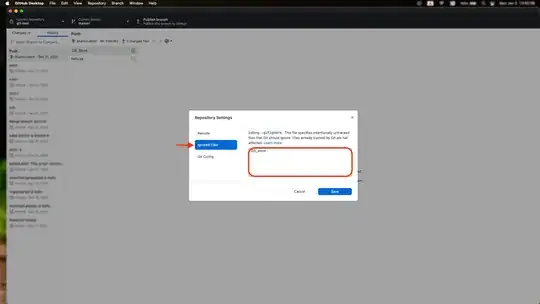
I already try to add symbol using Debug > Options And Settings > Debugging > Symbols. Please refer to screenshot below :

enter image description here

And then I try to attach the process to debug my code. Please refer to screenshot below : enter image description here enter image description here

My problem is still the same like in the first screenshot.

HariEko
  • 395
  • 1
  • 11
  • 1
    Is your customization a binary (.dll) extension? If yes, do you see the corresponding .pdb file in the bin directory? – Gabriel Aug 12 '16 at 14:01
  • of course, there is the .pdb file corresponding to the (.dll) extension in bin directory – HariEko Aug 15 '16 at 04:05
  • Some breakpoints are only shown as full when the assembly is used. Have you tried refreshing your website and accessing the page and calling the method which has a breakpoint set ? – Simon ML Aug 22 '16 at 21:18

2 Answers2

1

may help to check if web.config has compilation debug set to true.

    <system.web>
<compilation debug="true" ....
Nayan Mansinha
  • 291
  • 2
  • 4
0

I had the same issue and it turned out that the "Attach To" field in the Attach To Debugger screen was selected wrong.

Use only one of the highlighted options and not the crossed out options

Since Acumatica appears to be running in Native Code that loads the Managed code, so native code is also an option, however the debugger want be able to connect to your code.

yoel halb
  • 12,188
  • 3
  • 57
  • 52