3

We have a new sp getting released and during testing we found that when it runs its blocking other OLTP transactions. We found that initially it was because the new sp was causing lock escalation on a table and we reduced the number of batch size and was able to avoid that. even after avoiding lock escalation, it is still blocking oltp transactions that are coming in. I think its locking the same row which the oltp transaction is updating.

I need to find a way to track all the locks held and release by the new sp. I tried trace/xevents(lock acquired/release) and it does not look like its capturing all the lock, may be cause it happens so fast.

Just to understand how lock acquired look like, i tested it out by doing a select * from atable. but it gives me different results. When we do select * doesnt it put a series of page locks, so i should be seeing shared page locks in the trace. but all i see is IS lock acquired and released.

what is the best way to track all the locks for a given transaction?

jesijesi
  • 197
  • 1
  • 2
  • 7
  • Extended events should have caught it. Can you update your post with the session definition? – Ben Thul Jul 16 '16 at 05:01
  • 1
    I think you can try running your transaction in REPEATABLE READ isolation level and put a delay of let's say half an hour just before transaction commits. Once transaction reaches the delay statement, you can analyse the locks taken by querying sys.dm_tran_locks table. As transaction isolation level is REPEATABLE READ, it will not release any locks during the course of transaction until it commits.So you will have half an hour window to capture all the locks taken. – jayesh Apr 20 '18 at 12:37

1 Answers1

6

I ran below query in one session

begin tran
update orderstst 
set unitprice=unitprice+1
waitfor delay '00:00:20'

and ran below dmv while the query is running on other session..

select resource_database_id,request_mode,request_type,request_status,txt.text
 from sys.dm_tran_locks lck
 join
 sys.dm_exec_requests ec
 on ec.session_id=lck.request_session_id
  cross apply
  sys.dm_exec_Sql_text(ec.sql_handle) txt
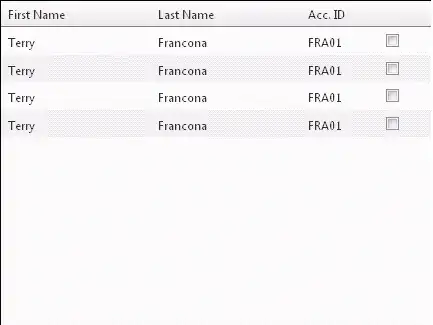
I got below data...

enter image description here

when the transaction is still not committed,but completed,i ran above dmv again.but didnt get any output.since this is not currently executing.

But running below dmv,will still give me lock info of all sessions holding locks..so you will be able to identify which session is holding more locks

  select resource_database_id,request_mode,request_type,request_status
 from sys.dm_tran_locks lck
 join
 sys.dm_exec_sessions ec
 on ec.session_id=lck.request_session_id

Above query gives me below info..

enter image description here

So in summary,you have to run DMV1 or DMV2 for some period through sql agent job and insert into some table for later analaysis..

Further from SQL 2012,you can use extended events also..

Go to Management ->Extended Events ,Right Click and say ,start new session wizard.

Give it a name and check start at server startup

enter image description here

next screen gives you an option to select default template or not,i choose default template for locks as shown below and click next..

enter image description here

In the next screen,you can choose different events,in channel,select all channels and do the same in categories too and select the events of your interest,i choose below ..

enter image description here

In this screen,you can select actions ,i choose text ,sessionid

enter image description here

In next screen,filter like say for example ..gather events only for a databasename like 'somename' or query like some text..

enter image description here

Next screen is where you can save file to disk for later analysis..

enter image description here

Complete rest of screens and finally select start event session immediately option..

When you are done with gathering data,go to extended events and stop the session you created.Right click and say view target data..which shows you below screenn

enter image description here

EDIT: as of 12/3/2019 the start new session wizard is now located here: enter image description here

TheGameiswar
  • 27,855
  • 8
  • 56
  • 94
  • Unfortunately the OLTP application is very sensitive and has to have an response time of less than 200ms for some transactions. so the blocking are short and its causing the transactions to run for around 400-800ms. so unfortunately the scheduled job might miss the exact moment.. that is why i am trying to analysis the exact locks and infact the rows that are getting blocked. I was wondering if i can tweak some setting in xevents to capture all the locks acquired. I am experimenting with xe – jesijesi Jul 16 '16 at 04:23
  • are you using 2012 ? how is transaction running or completing is less than 800 ms impact ? – TheGameiswar Jul 16 '16 at 04:29
  • Hi, we are using 2014. The application(financial) has an strict sla. so as part of it these transactions on the db should not be taking more than 200ms. – jesijesi Jul 16 '16 at 04:32
  • Thanks @TheGameiswar, it looks like increasing the max memory size did the trick. Now after spending time and successfully capturing the locks, i just realized that that is not useful(what was i thinking) As I have explained in my previous comment, my problem is sub 1 second blocking. Since the lowest value for "blocked process threshold" is 1 second i cant use that. I am testing wait_info and wait_completed x events which looks promising but acting weired. – jesijesi Jul 16 '16 at 08:27
  • extended events capture everything – TheGameiswar Jul 16 '16 at 08:33