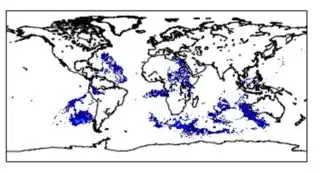
I am trying to plot data from a netcdf using Basemap but I guess since the latitude indices are inverted I get a map that is upside down. How should I fix this? Thanks!
fnc = Dataset(ncfile, 'r')
lat = fnc.variables['latitude'][:]
lon = fnc.variables['longitude'][:]
level = fnc.variables['level']
mydata = fnc.variables['Data'][:]
imgplot = plt.imshow(mydata[0, 0, :, :])
imgplot.set_cmap('RdYlGn')
plt.colorbar()
plt.show
m = Basemap(llcrnrlon = -180, llcrnrlat = -90, urcrnrlon = 180, urcrnrlat= +90, resolution = 'l', epsg=4326)
x, y = m(lon, lat)
im = m.imshow(mydata[0, 0, :, :])
m.drawcoastlines()
plt.show()

