0

I have a 3 columned data set. The third column is "string" values (i.e. names) while 1st and 2nd are corresponding name's values in 2 of the corresponding fields. I would like to plot a conventional graph between 1st and 2nd column, but then in the top side of the plot (i.e. side=3 in R) I would like to add the corresponding names to the corresponding points in the graph. How to do ?

Say I have a data set like :

A  B  C 
1  10 ABC
2  20 DEF

and plotting A vs B with C in the top (side=3) labelled to the corresponding point. An example plot is shown here
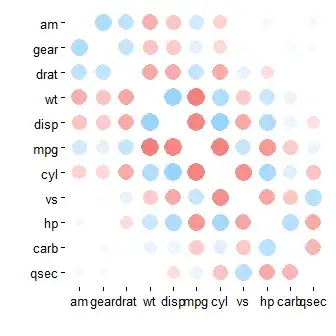
enter image description here

Sumedh
  • 4,835
  • 2
  • 17
  • 32
Ayan Mitra
  • 497
  • 1
  • 8
  • 20
  • You need to post data and code. It's also rather unclear that your requests to "plot a conventional graph between 1st and 2nd column" and "plotting A vs B with C in the top" actually mean. Might be necessary to mock up an example in ImageMagick or GIMP – IRTFM Jul 06 '16 at 20:55
  • Possible duplicate of [axes labels for 3 variables](http://stackoverflow.com/questions/33940163/axes-labels-for-3-variables) – Batanichek Jul 07 '16 at 18:55

1 Answers1

0

**This is the solution **

    plot(cc$z[1:10],cc$y[1:10],col=2,pch=20,las=1,xlab="Redshift",ylab=expression(paste(mu)))
     axis(3, at=cc$z[1:10], labels=cc$name[1:10],las=2,cex.axis=0.5)
Ayan Mitra
  • 497
  • 1
  • 8
  • 20