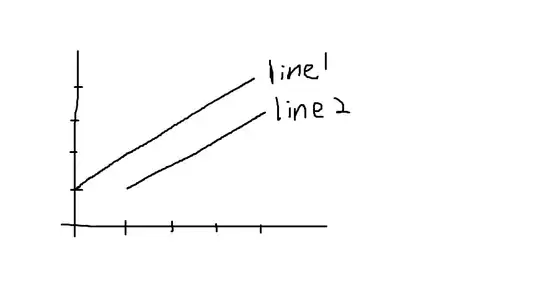
Is there a way to make the data come in halfway through the chart in angular-chart.js?
Like in the picture above, line 2 comes in at some point later in the graph.
right now my data looks something like this:
[
[1, 2, 3, 4],
[0, 1, 2, 3]
]
but I want it to look something like this instead:
[
[1, 2, 3, 4],
[1, 2, 3]
]
and explicitely state that the second set of data should come in at point x1 along the x-axis, or that the second set should use the 3 data points and plot them having a bias towards the right, rather than a bias towards the left.
I've tried looking for it but I haven't found anything.
