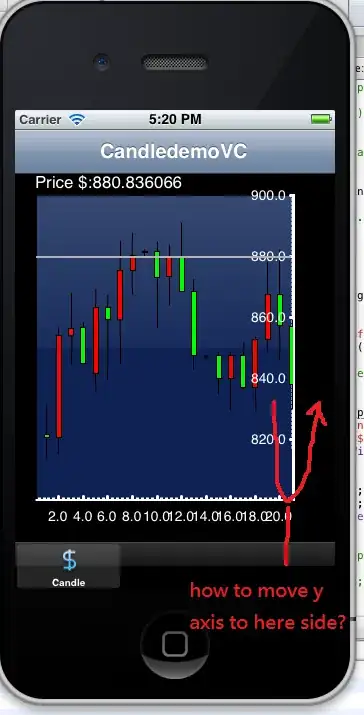
We can plot candle stick chart using chart series function chartSeries(Cl(PSEC)) I have created some custom values (I1,I2 and I3) which I want to plot together(overlay) outside the candle stick pattern. I have used addTA() for this purpose
chartSeries(Cl(PSEC)), TA="addTA(I1,col=2);addTA(I2,col=3);addTA(I3,col=4)")
The problem is that it plots four plots for Cl(PSEC),I1,I2 and I3 separately instead of two plots which I want Cl(PSEC) and (I1,I2,I3)
EDITED
For clarity I am giving a sample code with I1, I2 and I3 variable created for this purpose
library(quantmod)
PSEC=getSymbols("PSEC",auto.assign=F)
price=Cl(PSEC)
I1=SMA(price,3)
I2=SMA(price,10)
I3=SMA(price,15)
chartSeries(price, TA="addTA(I1,col=2);addTA(I2,col=3);addTA(I3,col=4)")


