4

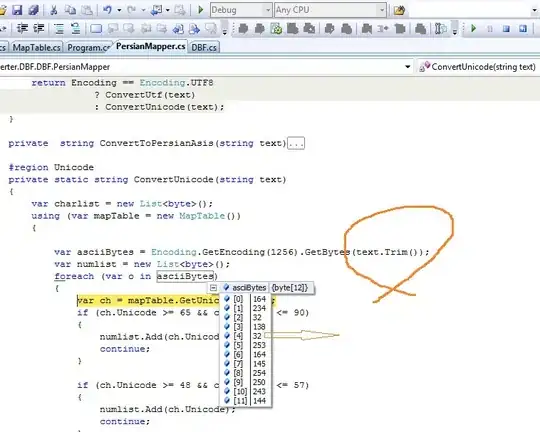
When the cursor is placed over the calendar chart date should be popup like second attached image (like tool-tip), in my code it showing like (refer First figure)below the chart, I want my output as in Second Figure. Please guide me to fix this issue, and below is see my code.

    <script>  
      $.getScript("https://www.google.com/jsapi", function () {
          google.load('visualization', '1.1' , { 'callback':  calenderchart, 'packages': ['calendar'] });
      });

    function calenderchart(data) {

       var dataTable = new google.visualization.DataTable();
       dataTable.addColumn({ type: 'date', id: 'Date' });
       dataTable.addColumn({ type: 'number', id: 'Won/Loss' });
       dataTable.addRows([
          [ new Date(2012, 3, 13), 37032 ],
          [ new Date(2012, 3, 14), 38024 ],
          [ new Date(2012, 3, 15), 38024 ],
          [ new Date(2012, 3, 16), 38108 ],
          [ new Date(2012, 3, 17), 38229 ],
          // Many rows omitted for brevity.
          [ new Date(2013, 9, 4), 38177 ],
          [ new Date(2013, 9, 5), 38705 ],
          [ new Date(2013, 9, 12), 38210 ],
          [ new Date(2013, 9, 13), 38029 ],
          [ new Date(2013, 9, 19), 38823 ],
          [ new Date(2013, 9, 23), 38345 ],
          [ new Date(2013, 9, 24), 38436 ],
          [ new Date(2013, 9, 30), 38447 ]
        ]);
        var chart = new        google.visualization.Calendar(document.getElementById('calendar_basic'));
        var options = {
            title: "",
            tooltip: {isHtml: true}
        };
        chart.draw(dataTable, options);

    }
</script>
<body>
    <div id="calendar_basic" style="width: 1000px;"ng-init ='calanderchart()'></div>
</body>
enter image description here

enter image description here

nbering
  • 2,725
  • 1
  • 23
  • 31

1 Answers1

0

seems to work fine here, is there more you can share?

any CSS on your page?

google.load('visualization', '1.1', {
  callback: function () {
    var dataTable = new google.visualization.DataTable();
    dataTable.addColumn({ type: 'date', id: 'Date' });
    dataTable.addColumn({ type: 'number', id: 'Won/Loss' });
    dataTable.addRows([
      [ new Date(2012, 3, 13), 37032 ],
      [ new Date(2012, 3, 14), 38024 ],
      [ new Date(2012, 3, 15), 38024 ],
      [ new Date(2012, 3, 16), 38108 ],
      [ new Date(2012, 3, 17), 38229 ],
      [ new Date(2013, 9, 4), 38177 ],
      [ new Date(2013, 9, 5), 38705 ],
      [ new Date(2013, 9, 12), 38210 ],
      [ new Date(2013, 9, 13), 38029 ],
      [ new Date(2013, 9, 19), 38823 ],
      [ new Date(2013, 9, 23), 38345 ],
      [ new Date(2013, 9, 24), 38436 ],
      [ new Date(2013, 9, 30), 38447 ]
    ]);
    var chart = new google.visualization.Calendar(document.getElementById('calendar_basic'));
    chart.draw(dataTable, {
      tooltip: {isHtml: true}
    });
  },
  packages: ['calendar']
});
<script src="https://www.google.com/jsapi"></script>
<div id="calendar_basic" style="width: 1000px;"></div>
WhiteHat
  • 59,912
  • 7
  • 51
  • 133
  • is working fine,using this code getting error another chart which did on this controller –  Jun 14 '16 at 13:30